The Following Post was written together with Arun Chopra of Fusion Point Capital
We all know it’s a global bull market. Economies across the globe have been suggesting strength to market participants all year. And of late, we’ve really seen signs of economic expansion spill over into ‘proof in the pudding’ indicators.
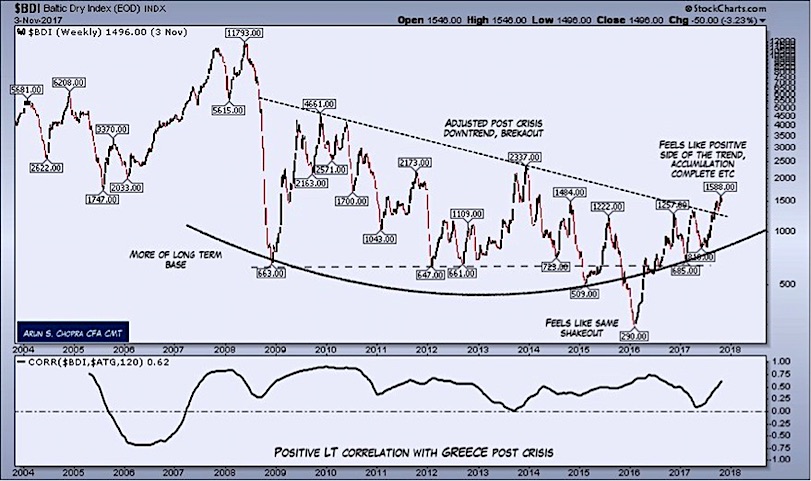
First let’s look at the Baltic Dry Index. ‘BDI’ has been considered a coincident economic indicator. Given that it’s been a decade since the global economy has been in sync, it’s fair to say BDI has lost its attractiveness as an indicator to the general investing populous.
What makes BDI relevant now is it has broken decade-long resistance. This has the look of a move that is just getting started.
Baltic Dry Index Chart… Breakout?
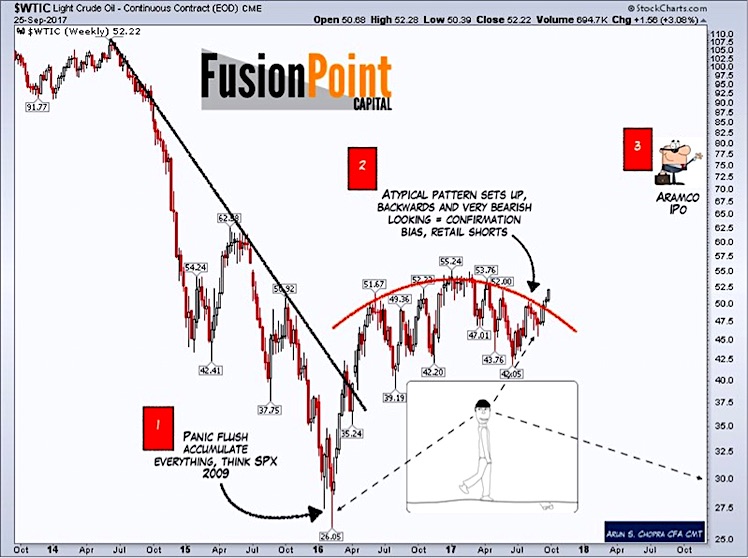
Commodity prices are telling us a similar story. In the middle of the summer, Brent Oil started to significantly lead WTI higher as both have now clearly broken out of year long bases.
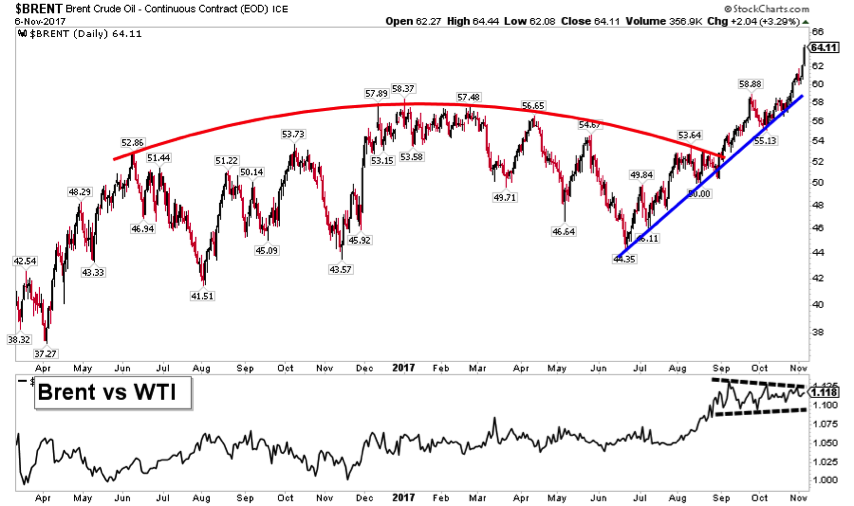
This is occured right as market sentiment dropped rapidly in the energy space. Behaviorally this tends to happen at important lows, specifically when everyone is looking backwards at the past vs the consolidation of price and potential future catalysts.
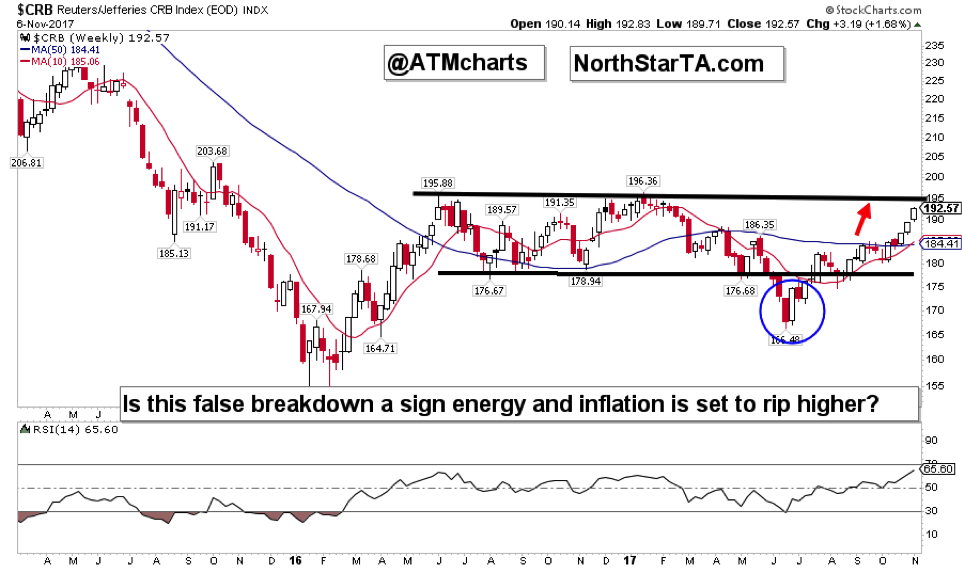
Commodity Index CRB sharply rejected new lows this summer in a false break of this range. All of a sudden, energy commodities are ripping hard. Although we can expect the 195 area to provide resistance, a move over 195 suggests another meaningful leg higher is in the cards.
Continue reading on the next page…

: Showing Some Signs of Emerging Strength")

