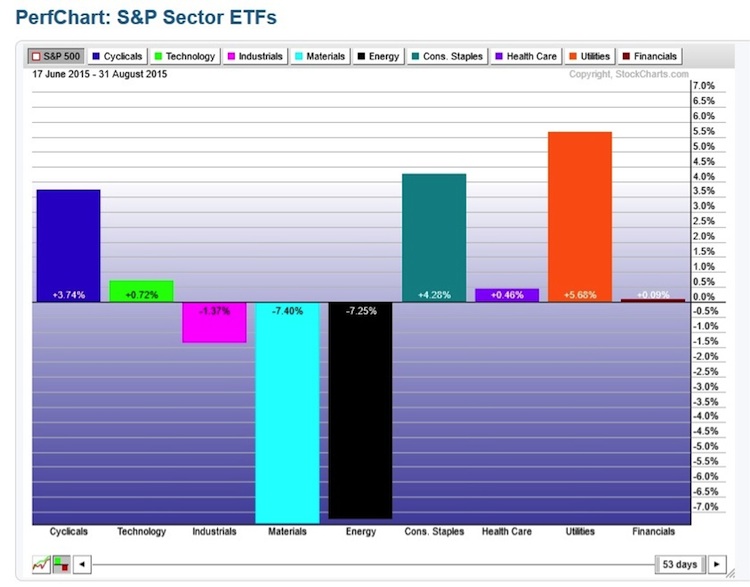
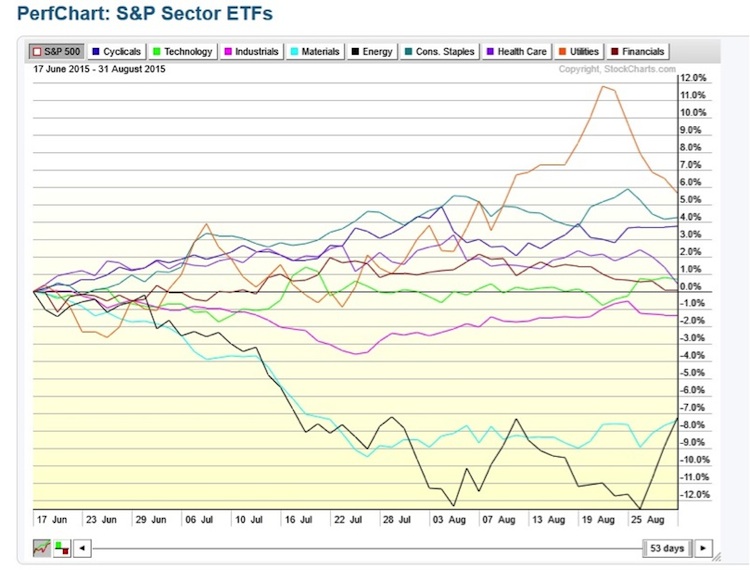
Charts 4 & 5 – Sector Performance. Cyclicals continue to be a sector leader post the June update. However, it should not be surprising in this volatile and uncertain phase to see bulls seeking safety in utilities and consumer staples. Technology and Financials are filling in the 4th and 6th spots respectively.
The Take Away
After an extended side-ways market, the stock market is in a correction. This market correction may need time to establish new bases, especially as nervous traders glance over to China and note that the Shanghai Composite has yet to form any sort of base. However, Cyclicals, Technology, and Financials offer long-term traders three sectors to begin looking into for ideas as the correction and ultimate recovery plays itself out.
Thank you for reading.
Twitter: @rinehartmaria
No position in any of the mentioned securities at the time of publication. Any opinions expressed herein are solely those of the author, and do not in any way represent the views or opinions of any other person or entity.


: Showing Some Signs of Emerging Strength")
