Too much can be made of political headlines but they are a reality that many deal with.
If rising uncertainty (whether because of news on tariffs or congressional investigations) leads to a sustained decline in consumer confidence, downside risks in the economy would likely grow.
Already, consumer confidence is lower than where it was a year ago, a decline consistent with deteriorating growth prospects.
If the consumer shakes off these concerns, any market volatility associated with investigations is likely to be short-lived. If confidence (and the President’s approval rating) slips from here, than consumer spending could weaken and the economic expansion could face a test heading into next year’s election.
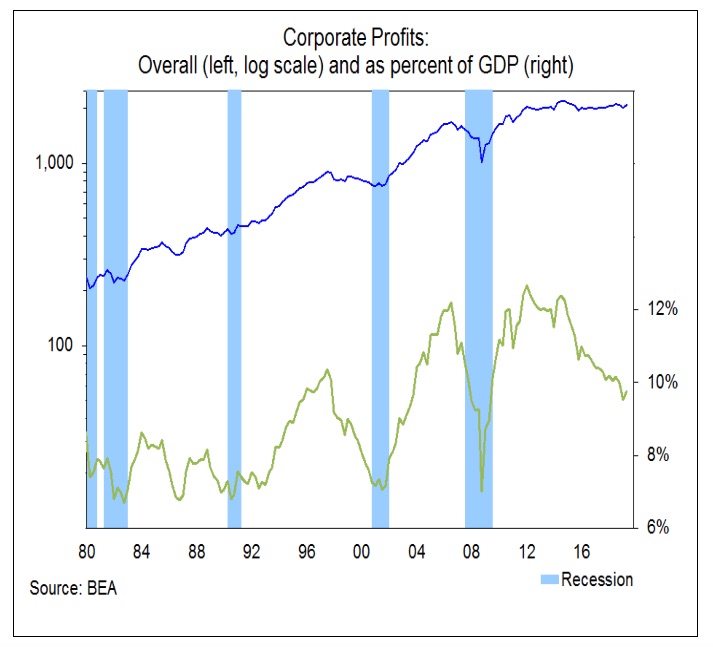
Economic uncertainties are coming at a time when corporate profitability has already become more challenging. Rising wages, while good for the consumer, mean that labor costs are going up and that has negative impact on profit margins.
Corporate profits (as reported in the GDP data) peaked five years ago and as a percent of GDP, profits are at their lowest level in a decade. With profit margins contracting, a higher level of revenue growth will be needed to fuel earnings growth.
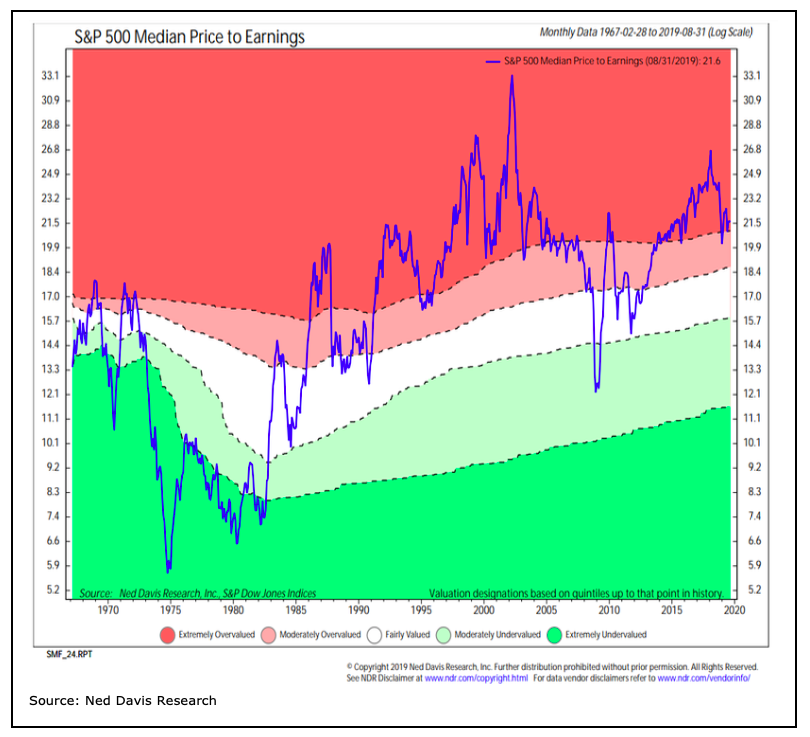
The increasingly challenging earnings growth backdrop comes at a time when stock market valuations are already stretched. While not at the highest level on record, valuations are at a level where forward returns for stocks have been muted.
Valuations are elevated in the US but international stocks are more attractively priced. For more on this please see our July Portfolio Perspectives piece that discusses the prospect of international leadership going forward.
Investor sentiment is as mixed as ever and seems to swing widely from week to week. Discerning the underlying view of market participants is as challenging as ever. The latest Investors Intelligence data shows more than 55% bulls and less than 17% bears, while the AAII survey of individual investors shows more bears than bulls.
One notable sentiment development in September has been flows moving toward equities. Equity fund outflows have been the norm of late (though even with this, household equity exposure remains elevated) but the first few weeks of September have seen a pronounced shift. Beneath the noise of weekly surveys, investors may be turning more complacent.
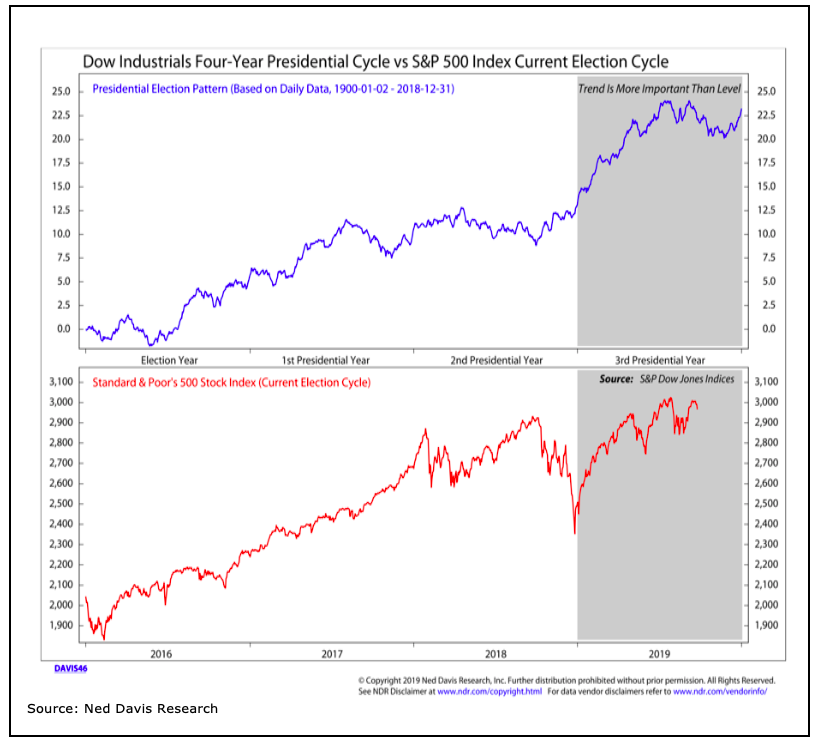
The typical seasonal pattern is for stocks to bottom late in September or October and then finish the year on an up note. Last year’s Q4 weakness was a notable exception to that pattern. Looking beyond annual patterns, Election cycle patterns suggest stocks could work higher into mid-2020 before experiencing pre-election volatility.
With political noise on the rise, there is a distinct possibility that election-related volatility will not wait until the middle of next year to emerge. While this could hinge on how consumer confidence responds, we may be facing an elongated cycle of noise and volatility.
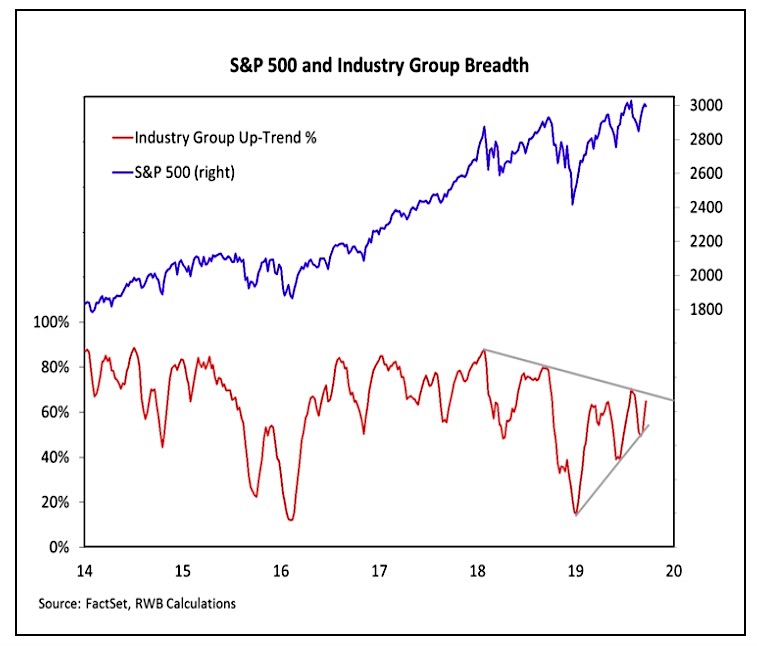
Expectations of better stock market conditions going forward are dependent on an improving view on the economy (consumer confidence will be the key there) and the health of the broad market. Stock market breadth has been improving in 2019.
Our industry group trend indicator has made a series of higher lows which is an encouraging shift from last year. However, the dominant pattern of lower highs that emerged in 2018 has not been broken. Moreover, the Value Line Geometric Index has recently made a series of lower highs and lower lows and is still 10% below its 2018 peak.
We do have evidence that would suggest this improving breadth backdrop is likely to come. We saw an early-year round of breadth thrusts as stocks rallied off their December lows and those have been followed with further breadth thrusts in September. These argue for stock market strength in 2020 and the possible emergence of a new cyclical up-trend.While the January breadth thrusts helped us move breadth from bearish to neutral in our weight of the evidence framework, we are waiting for the confirmation mentioned above to move breadth to bullish.
Twitter: @WillieDelwiche
Any opinions expressed herein are solely those of the author, and do not in any way represent the views or opinions of any other person or entity.

: Showing Some Signs of Emerging Strength")

