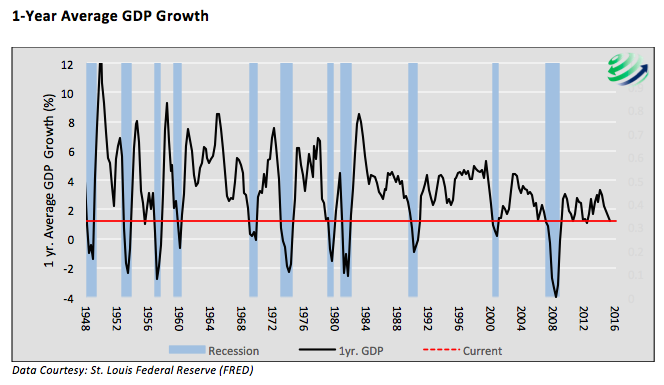
On Friday July 29th, 2016, the Bureau of Economic Analysis (BEA) released the 2nd quarter GDP data and revisions for prior quarters. At a disappointing annualized growth rate of only 1.20%, second quarter GDP widely missed consensus expectations of 2.50% growth. Coincidently the current 1-year average growth rate has risen at the same 1.20% and that annualized growth rate has declined for five quarters in a row.
For the most part, the recent bout of stagnation, highlighted by 2nd quarter GDP data, has not caught the attention of the media or the markets. As consultants to those who manage wealth we believe this data is vitally important, regardless of what others may think. Accordingly, we provide some context around this data to help you better grasp its magnitude.
The graph below plots average 1-year GDP growth on a quarterly basis going back to 1948. The blue shaded areas represent periods deemed recessionary by the National Bureau of Economic Research (NBER), and the red dotted line facilitates the comparison of the current 1.20% reading versus those of the past.
Here are four important takeaways:
- All recessions since 1948 started with an average growth rate greater than the current 1.20% rate.
- There are only three instances where the 1-year growth rate was below the current level and recession did not occur. In the two most recent instances (2011/2012), weak growth was met with renewed rounds of extraordinary stimulus in the form of quantitative easing (QE).
- Only 18% of all observations going back to 1948 are below the current 1.20% level.
- Of that 18%, 94% occurred during or within a quarter of a recession.
Based on recent history, one might elect to maintain an aggressive stance towards equities and other risky assets in anticipation of another round of stimulus from the Federal Reserve. One should be reminded however, the primary difference between where we are today versus those two recent periods is that the Fed’s posture was not leaning toward interest rate hikes as they are now.
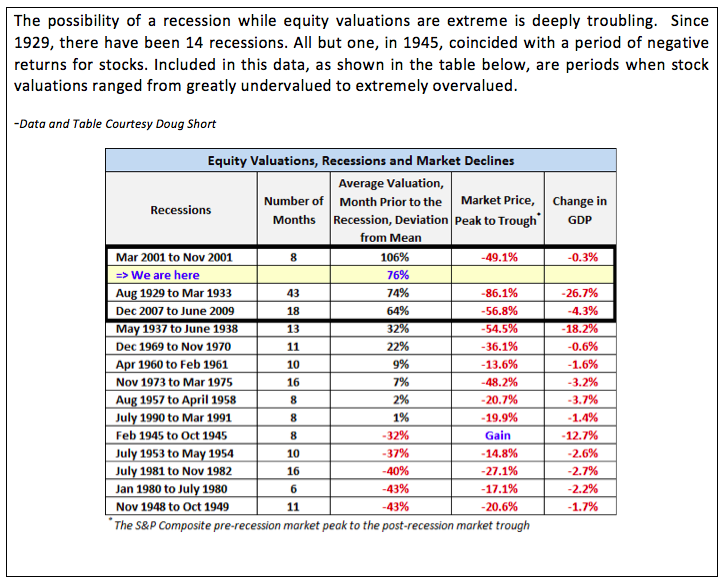
Though difficult in a world of poor returns, equity investors should remain defensive and highly concerned by the recent economic data. As a reminder, re-consider the following table and excerpt from “Dear Prudence” published in April 2016.
720 Global is not calling for an immediate equity market sell-off. In fact, the market may appreciate further, irrespective of weak economic data, declining earnings and historical precedent. That said, periods like today, characterized by extreme valuations and weak economic activity, have ultimately proved disastrous for investors. Those managing wealth for others should be cognizant of the implications present in today’s stagnating economy.
Thanks for reading.
Twitter: @michaellebowitz
Any opinions expressed herein are solely those of the author, and do not in any way represent the views or opinions of any other person or entity.

 and Semiconductors (SMH)")
 Make A Higher Low?")


 Make A Higher Low?")
")