In today’s financial market analysis, we’ll take a specific look at the chart for the 30 year U.S. treasury bond INDEXCBOE: TYX
Note that the 30 year treasury bond fell by nearly 2% to 156.16 last week.
Based on its market cycles, we believe treasury bonds are nearing the end of their short-term declining phase.
As highlighted on the chart below, our projection is for a brief rally as the next rising phase begins.
That move into short-term resistance zone should set up another move to the downside, with long-term rates again popping to recovery highs.
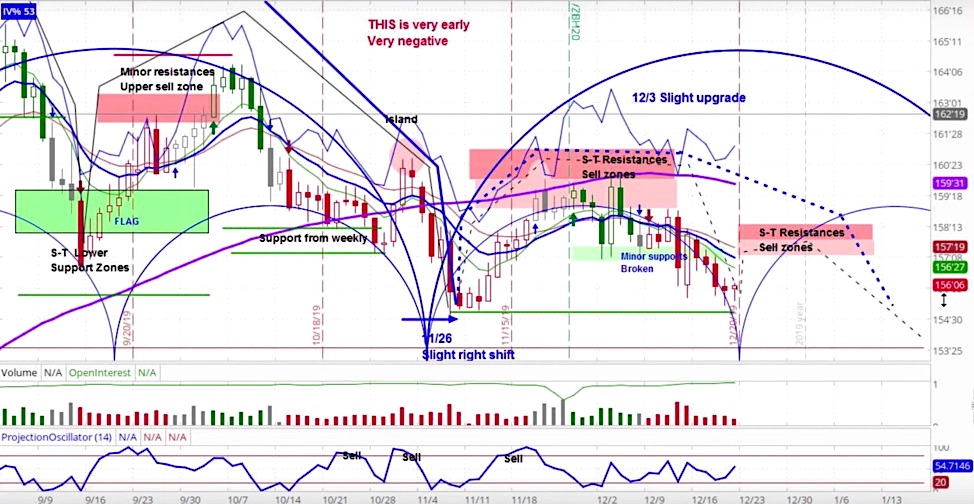
Here’s the chart…
30-Year Bond Futures (/ZB) Daily Chart
For a more detailed analysis of both of these charts, check out the latest episode of the askSlim Market Week show.
Twitter: @askslim
Any opinions expressed herein are solely those of the author, and do not in any way represent the views or opinions of any other person or entity.

: Worrisome to Broader Market?")

