“The market will do whatever it has to do to embarrass the greatest number of people to the greatest extent possible.” -Walter Deemer
Markets like these are when Walt Deemer’s quote immediately comes to mind. You feel confident in a certain outlook, only to see the market do something completely different.
Here we’ll unpack what I feel are the three most painful market environments, then try and decide where we’re at today in 2019.
#3 The Bull Market Correction
Any Elliott Wave aficionado will tell you that an uptrend consists of impulse waves (where the market moves in the direction of the major trend) and corrective waves (where the market moves against the trend).
Anyone who has ever traded a stock is familiar with the stepwise movement of peaks and valleys as a price chart slowly trends upwards.
However, the fact that the overall trend continues higher does not make those little corrective waves feel any better.
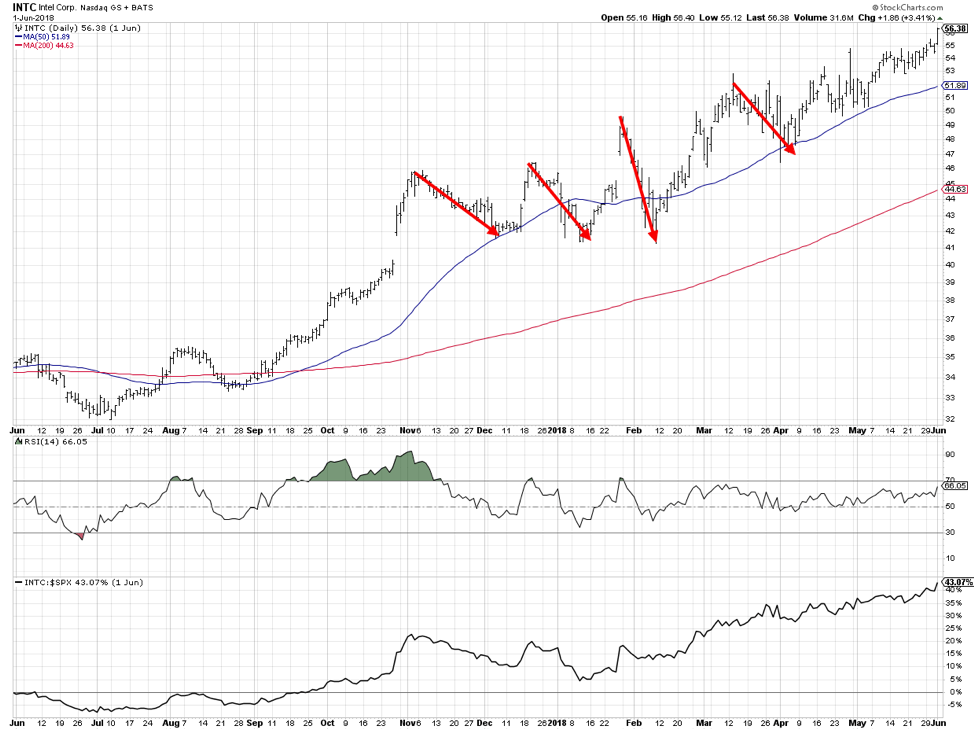
Here we have a chart of INTC from June 2017 to June 2018. Overall, a consistent uptrend. Great chart if you were long!
But look at some of the corrective waves during that long uptrend. Even if you’re long and strong, believing in the long-term uptrend, a correction from 46 to 42 during the month of November just does not feel good.
In fact, the long-term uptrend included a number of corrective waves that cause even the most committed bulls to sweat just a bit.
This is a good argument for always remembering the direction of the major trend, and pay attention to how low the price goes on pullbacks. As long as we continue to make higher highs and higher lows, the trend is up.
But a short-term selloff within a long-term uptrend will often cause anxiety and short-termism, both of which are bad for your portfolio health.
#2 The Sideways Market
One of the worst questions I’ve received as a technical analyst is, “Are you bullish or bearish on XXX?” XXX can be the market, a sector, a specific stock, a commodity, or anything else with a price.
People often forget that the market can go one of the three directions: up, down, or sideways.
Sideways markets are brutal because of the lack of directional opportunity. As a trend-follower, I’m looking for trends. And while a sideways trend is easy to spot, it’s difficult to make money when the price is essentially going nowhere!
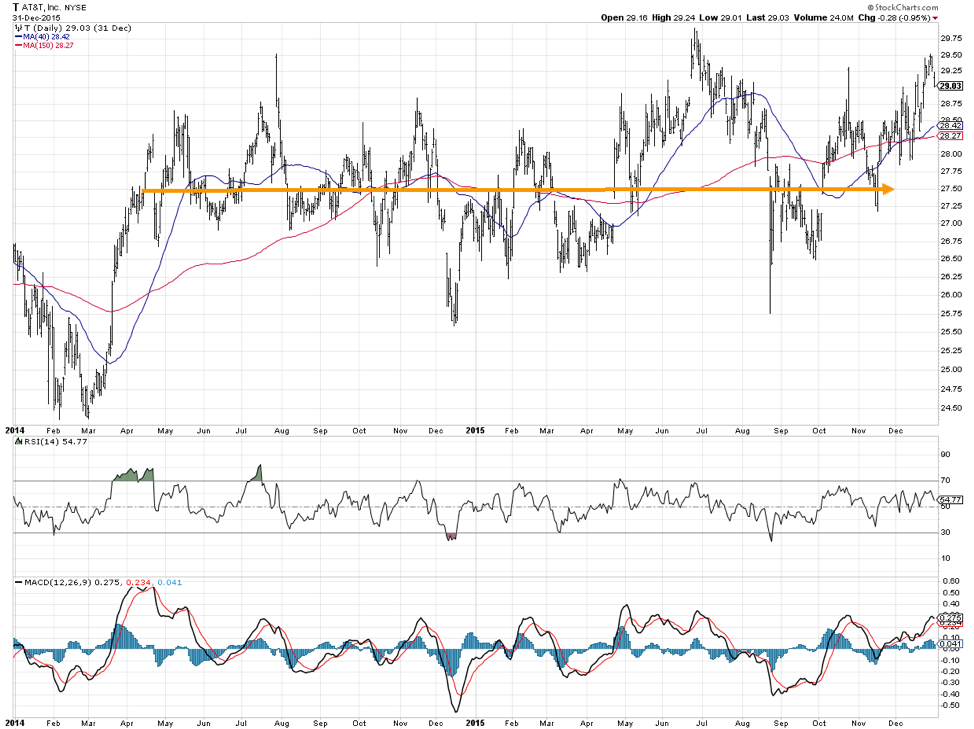
This chart of AT&T (T) shows how from 2014-2016, price went essentially nowhere. So buy and hold netted you exactly zero over this time period.
Now if you had a shorter-term horizon, were there tradable moves in there? Absolutely. And would you receive a decent dividend for holding the stock? Absolutely. But in terms of capital appreciation, there’s nothing worse than a market that just won’t move in a meaningful way.
#1 The Bear Market Rally
I would argue that the most challenging market to deal with is the bear market rally. You’ve finally decided that stocks are going lower, you’ve moved to cash or some other defensive posture, and you watch with despair as prices reverse higher.
Bear market rallies are where FOMO (fear of missing out) can generate quite an emotional response from clients as well as in your own mind.
The worst part is when you finally get sucked in, throwing in the towel and taking on new long positions, only to see the bear market resume soon after.
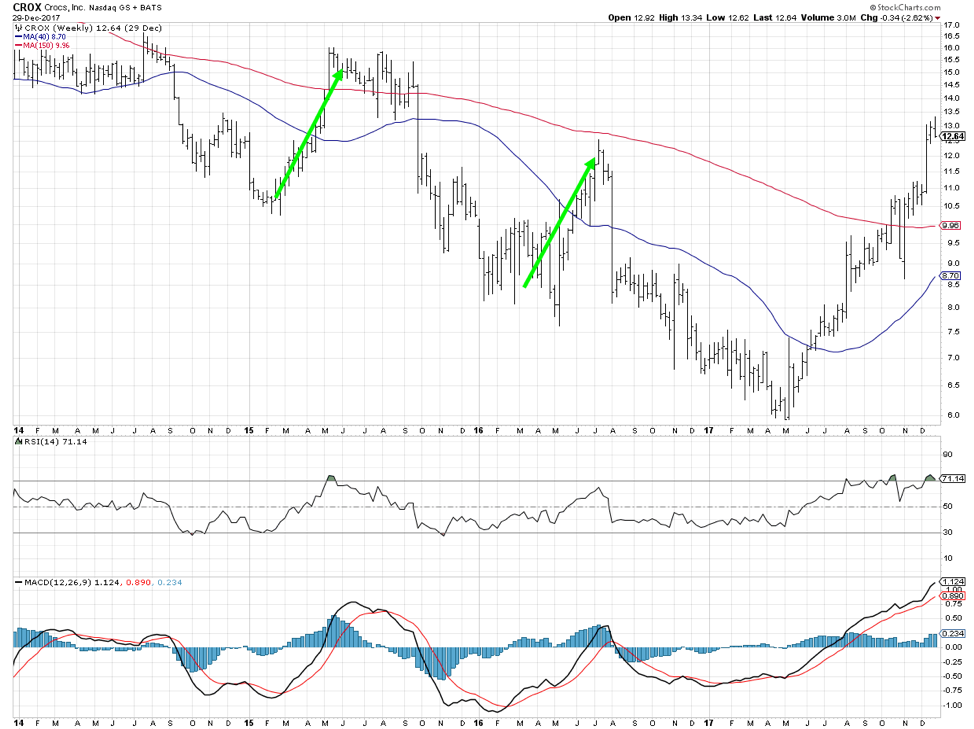
The chart of CROX from 2014-2018 shows you how tempting bear market rallies can be. The rallies in 2015 and 2016 saw the price break above its most recent swing highs, giving investors false confidence before the bear market resumed.
This brings us to the current market environment. Are we in a bear market rally? Or the beginning of a new bull market phase?
I’ve been bearish for a while based on long-term trend-following models, supplemented by negative breadth readings and the weakness apparent in individual price charts.
But when the SPX puts in a higher low on the daily chart, I have to turn at least neutral in the short-term. When the SPX breaks above its most recent swing highs, I have to lean more bullish in the short-term.
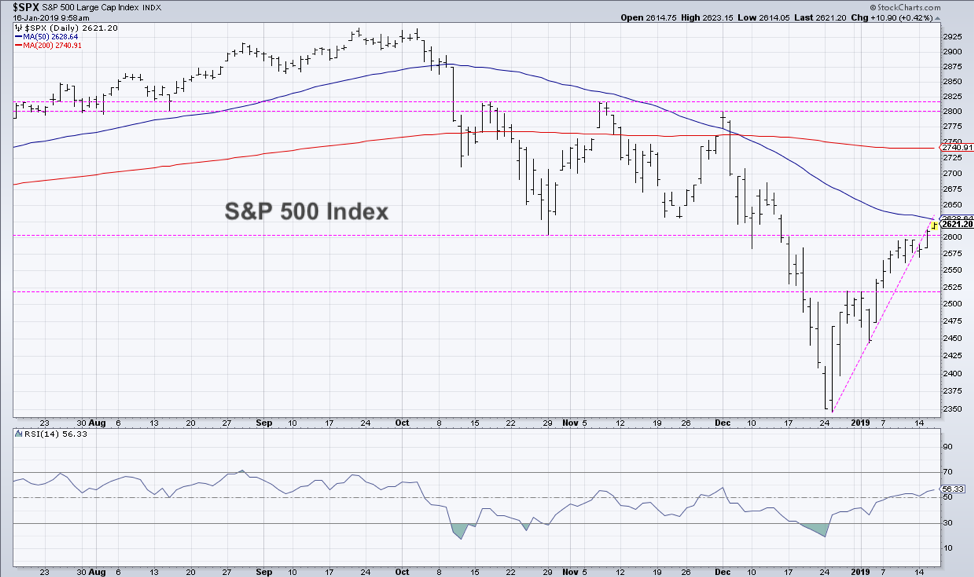
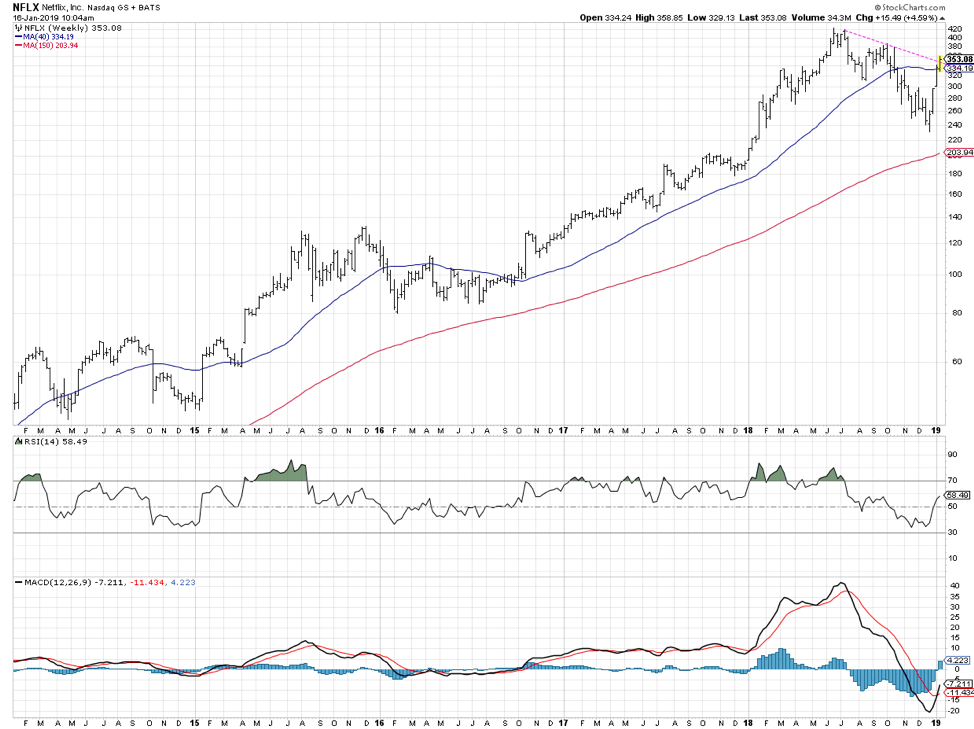
When stocks like AMZN and NFLX threaten to break above trendline resistance, I just can’t be short-term bearish anymore.
So where are we at? I believe we’re in a short-term sideways market within a long-term bear market. I don’t see stocks going meaningfully higher before we either “back-and-fill” to the 2018 lows or go meaningfully lower.
What would tell me I’m wrong? Stocks like AMZN and NFLX breaking out and following through to the upside. Improving breadth. Higher lows and higher highs not just on the daily charts but on the weekly charts. Long-term trend-following models giving neutral to bullish readings.
Until then, the long-term trend remains down.
Learn more about my research over at Sierra Alpha.
Twitter: @DKellerCMT
Any opinions expressed herein are solely those of the author, and do not in any way represent the views or opinions of any other person or entity.


