2020… Worst of Times
At the start of the new decade, markets are fraught with uncertainty: global economic growth looks poised to slow, forecast corporate earnings expectations are mixed, valuations are at all-time highs, and central bank accommodation has pushed credit spreads to cycle lows. Add the uncertainty of the U.S. presidential elections, equity correction risks have been elevated with the big question being what will trigger it.
But even with this being the on-going backdrop of 2020, it turns out the COVID-19 pandemic has served as the tail risk that is changing everything!
The World Health Organization (WHO) officially declared the COVID-19 outbreak as a pandemic on March 11, but panic had already settled in weeks before that. Governments across the globe began shutting down their economies to create social distancing and combat this unknown pandemic. The result of these actions was a self-induced global recession that at its beginning phases sparked dramatic amounts of volatility in just about every asset class.
Beginning in the last week of February, global equity markets were thrown into disarray at an unprecedented velocity, with the S&P 500 drawing down -33.9% in a mere 23 days and the VIX spiking to a high of 82.7 on March 16. The TSX fared worse, falling -37.4% over the same time span. At the same time, bond liquidity abruptly dried up and became the central issue in fixed income trading amid a flood of sellers and dealers’ balance sheets being filled to their limits. This resulted in many bond ETFs widely disconnecting from their stated NAVs and corporate spreads ballooning to a 10-year high of 433 basis points (bps)
While this was happening, the U.S. dollar whipsawed as investors struggled to decide if it was a safe-haven asset. Gold prices, though having fallen -12.5% in mid-March, began a rally to over U.S. $2,000/oz. that wouldn’t stop for another 6 months. Elsewhere, the precipitous decline in global energy consumption induced a surplus expansion and price free falls in the crude market that, due to the lack of physical storage capacity at the time, even caused many barrels of oil to trade in negative territory in April.
It didn’t take long for central banks to intervene. Beginning in March, the U.S. Federal Reserve (Fed) and the Bank of Canada (BoC) vaccinated capital markets with steep interest rate cuts and balance sheet expansion programs that provided the necessary liquidity to support the system. By the end of the month, the U.S. Fed funds rate and the BoC’s overnight lending were 2 bps and 25 bps, respectively. Governments simultaneously deployed unprecedented quantities of fiscal policy support to backstop the damage that social isolation would wreak on their economies.
The combination and magnitude of these fiscal and monetary policy measures laid the foundation for a resumption in risk- on activity that turned markets upside-down almost as quickly as they had declined. What followed the carnage was a sharp reversal in perception and behavior: global equity markets marched decidedly higher and fixed income markets closed their losses, all while the global economy was in a very real recession.
2020… Best of Times
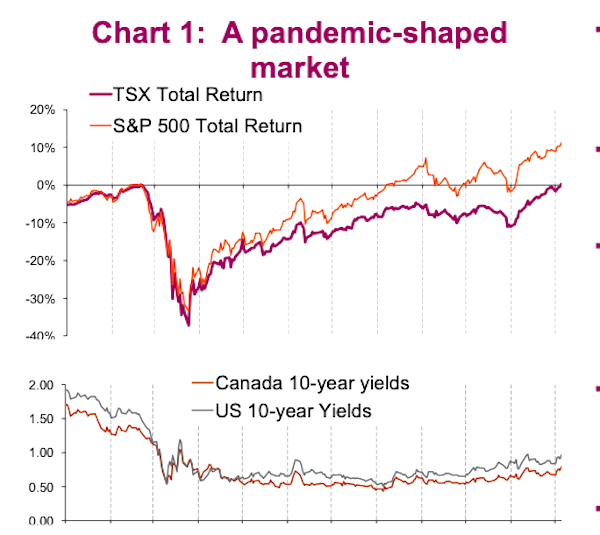
Global equity markets have recovered their first-quarter losses and are trading up for the year, driven in large part by a heavy shift into risk-on sentiment post-March, central bank support, and most recently the resolution of the U.S. presidential election and higher visibility of a vaccine introduction. Year-to-date (YTD) the S&P 500 was up +16.5% and the MSCI World Index, as measured in Canadian Dollars, was up +9.6%. The TSX lagged but still managed to post a respectable +5.8% gain for the year.
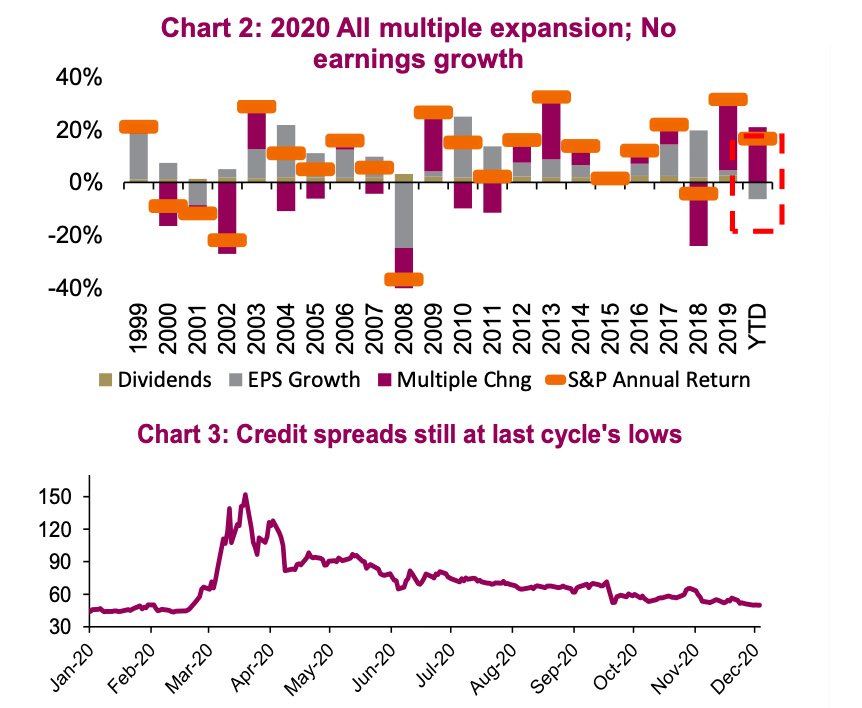
For most of 2020, return attributions were largely concentrated in growth stocks, mainly within the technology and health care sectors. However, November is proving to be potentially a pivotal month, as the deflationary forces of the pandemic started exhibiting signs of fading and the pendulum swung in favor of more value-oriented names (more on this ahead). Still, it goes without saying that we are currently operating in an earnings-starved market. YTD, just about all the S&P 500 returns were attributable to multiple expansion (Chart 2).
This year was also a record-breaking year for IPOs, with a strong rebound in capital formation activity during the back half of the year certainly aiding in keeping sentiment bullish. YTD, U.S. primary listings via traditional IPO listings and special- purpose acquisition companies, or SPACs, have totalled U.S. $128B, with SPACs representing about 48% of these issuances. Approximately U.S. $203B was raised through secondary issuances, half of which was raised in the months of May and June alone as companies shored up cash on their books.
Bond yields are even lower than a year ago today, with real rates having moved into negative territory. The combination of 1) the Fed’s shift in policy to average its inflation targeting, which implies lower rates are here to stay for longer; 2) reflationary expectations; and 3) continued liquidity support via bond purchasing programs and curve control will likely continue to support prices and put pressure on yields, though the road ahead remains unclear.
Meanwhile, excluding the blowout in March, credit spreads have gradually returned to where they started the year at ~50 bps (Chart 3). This means that, after a year, the market is still rewarding investors for taking on the risk by less than half a percent a year. It seems like investors are still just as willing to pick up nickels ahead of a potential steamroller. This year’s uncertain economic backdrop proved a boon for gold, amid haven-purchasing and inflation-hedging; YTD, ETF holdings of gold have increased +28.9%. The dollar, meanwhile, continues to hit fresh 2-year lows amid strong equity market performance; YTD, the DXY index is down -5.9%.
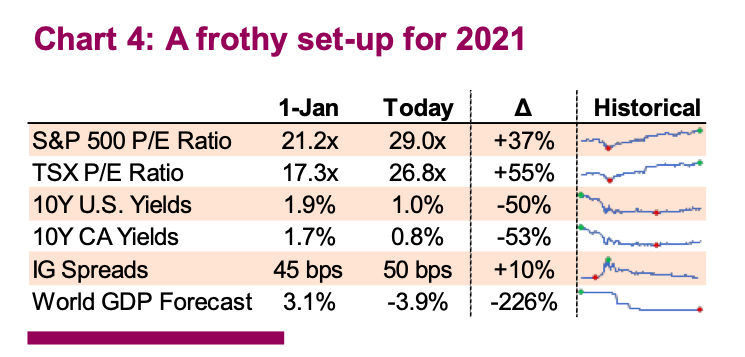
The set up for 2021 appears challenging (Chart 4). Equity valuations are inflated, yields remain compressed, and both earnings and economic growth forecasts lay in uncertain waters. Still, government stimulus and monetary policy appear supportive, though this year’s heavy reliance on these measures may prove to be a unique risk heading into the new year. Today, the importance of flexible asset allocation has never been greater. Many are beginning to see the light at the end of the tunnel; but if there’s anything that this year has taught many, it’s that those lights may very well be the headlights of an oncoming train.
Twitter: @marketminute
The author may have a position in the mentioned securities at the time of publication. Any opinions expressed herein are solely those of the author, and do not in any way represent the views or opinions of any other person or entity.


