As we flip the page to January 2019, I thought I’d share a stock market checklist for the beginning of the new year.
Having already seen and read more predictions and projections for the 2019 financial markets than any person can stomach, I will spare you my exercise in fortune-telling.
Rather, I will provide some commentary on the credit markets, along with some Demark analysis of the S&P 500 (NYSEARCA: SPY) and the broader stock market. And, all together, what it may be telling us about the beginning of 2019 for the financial markets.
Below are some random thoughts (roughly in order of importance) about the current state of affairs and what I’ll be watching for during the first few weeks of the new year.
1. The corporate credit market laid an egg in December, both in terms of spread widening and lack of new issuance. Fortunately, it has a chance to redeem itself beginning next week. January is one of the two most important periods of the year during which companies bring new issues to market (the other being September).
$130-150B of new issuance would cure lots of ills for credit players; it would provide companies with the cash to continue their buybacks – especially now that stock prices have broadly retrenched – and it would also signal that the fuel for M&A activity remains readily available.
2. The Fed latest rate increase flattened the 2-10 yield curve into single digit bps. Despite the continued compression in the 10yr Treasury Yield, the curve has managed to recoup some of the flattening and closed the year at +19bps. Together with the tone of corporate credit, this remains THE most important tell for the sustainability of the bullish credit cycle that began in January of 2009 (“January” is not a typo; stocks bottomed in March of 2009, but – not by coincidence – the corporate credit market came back to life with the January issuance period).
An inversion of the curve would likely mark the death-knell for this credit cycle, much as it happened in 1998 and 2006, despite the fact that stocks did not notice until 18-24 month later.
3. There is nothing like optimism to chase away bearishness. A truism for sure, but it is easier said than seen when it happens. My tell on this front is the 3-month VIX curve which has been inverted for the better part of the last 3 months. By historical measures, this is a pretty long time for the curve to be inverted. As background, an inverted VIX curve suggests that equity players are willing to pay more for near dated protection than for protection 3 months out. They are scared of the here-and-now.
If/when the curve goes back into contango (and remains so for a sustained period), it will signal that stock traders believe the worst is behind for equities, and they can return to hedging for the longer term, rather than paying-up now just to survive. Since the Christmas Eve stock beating, the curve has managed to steepen by 10 points, but remains approximately 4 points to the negative. A good start, but getting to +1 and holding is what bulls want to see.
4. With regard to technicals, long-time readers may know that I’m a big fan of DeMark indicators. Below is a daily 6 months chart of the S&P 500 (through year-end). I have written a number of pieces for SeeItMarket on how to read basic DeMark signals, so I won’t rehash that here. What I would like to see is the current TD Sell Setup (currently on Bar 4 – Wed) completing. The chart below shows bar 3 as it was through year-end. It won’t mean that all is good for stocks, but it will suggest that buyers are not dead-and-buried.
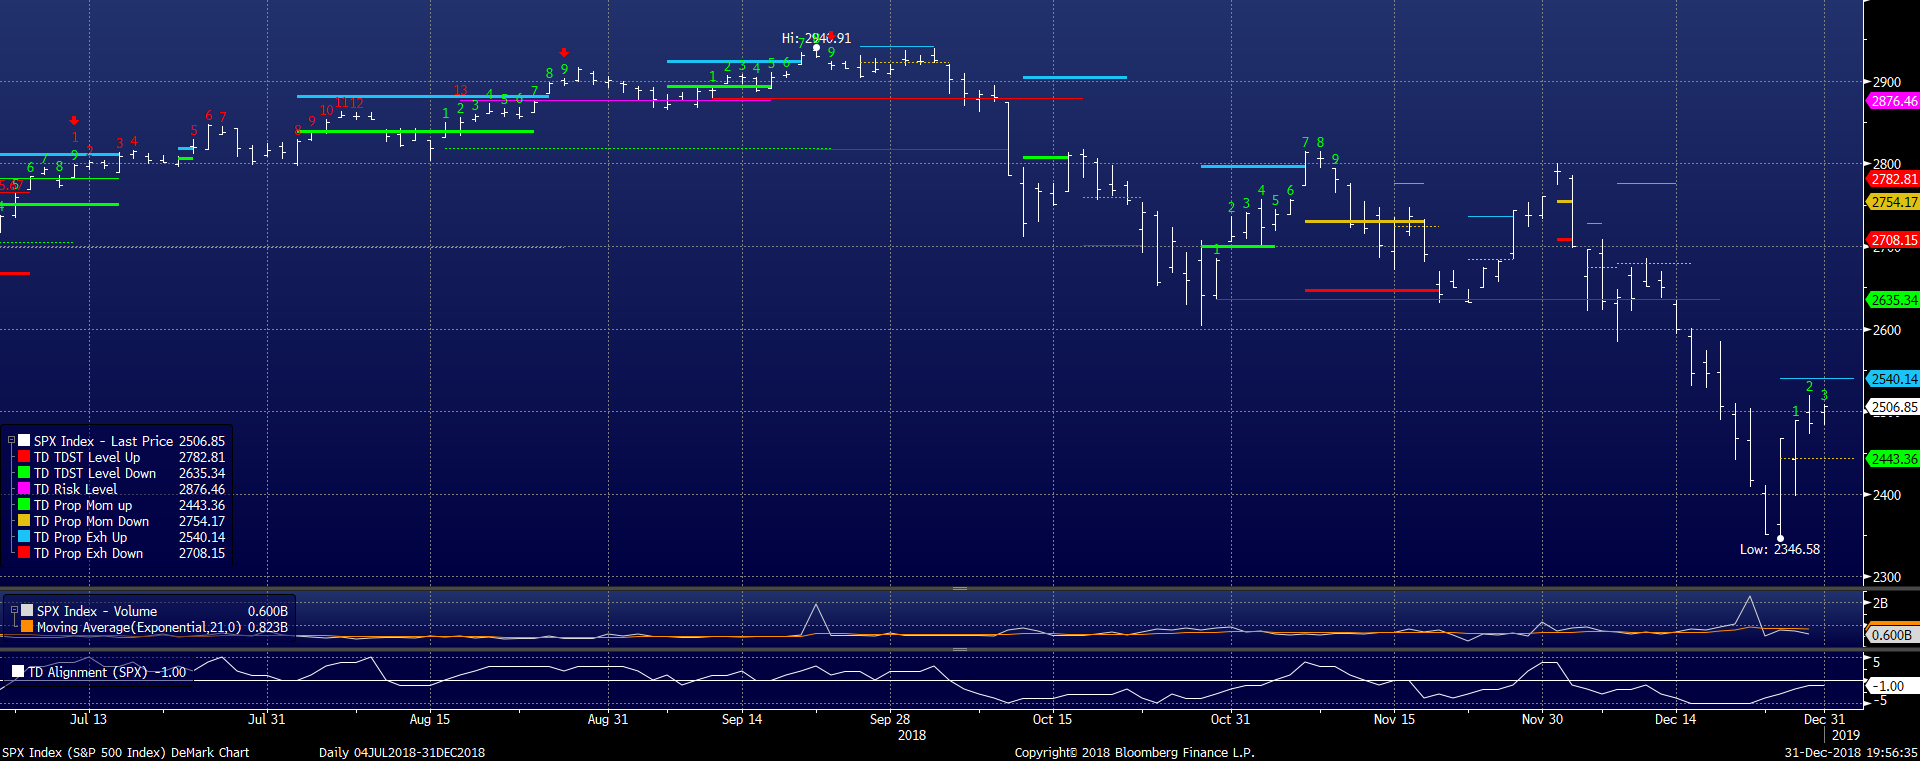
The next helpful step would be a cancellation of the ongoing weekly TD Buy Setup, currently on Bar 5. The first best chance bulls have to make it happen will arrive the week of January 18, when the SPX will simply have to close above 2416.62 to erase the weekly Buy Setup.
So here it is: Show me a good January corporate credit performance, the re-steepening of the 2-10 Yield Curve and the 3-month VIX curve, and technical evidence that equity buyers have more than just a fibrillating pulse. The more of these the markets can pull together the greater the chances that the damage of the last three months can be left behind.
I wish everyone a Healthy and Happy New Year!! If you have those two, the “Wealthy” part will be just a sideshow.
Twitter: @FZucchi
The author has a position in the S&P 500 (SPY) at the time of publication. Any opinions expressed herein are solely those of the author, and do not in any way represent the views or opinions of any other person or entity.

: Showing Some Signs of Emerging Strength")
