The past month or so has seen stocks rally back to new all-time highs (Russell 2000 and Nasdaq) or backtest old highs (S&P 500 and Dow Jones Industrials).
This has investor sentiment on the rise… but is the stock market really that healthy?
Today we take a look with an eye toward the coming months. We’ll highlight key themes, trends, and understandings. Buckle up – there’s 6 more months to go!
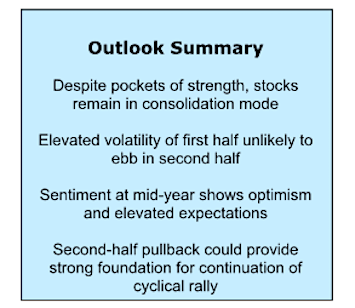
Highlights:
- Central Banks Moving Away from Accommodating Policies
- Economy on Firm Footing as Growth Accelerates
- Valuation Excesses Have Not Been Relieved
- Investors Moving from Concern to Elation
- Seasonal Headwinds Could Weigh on Small-Caps
- Breadth Indicators Not Yet Signaling Resumption of Uptrend
The weight of the evidence deteriorated over the first half of 2018 (from +1 to 0 to -1) and at mid-year argues that near-term caution is warranted. This was due to shifts in the Market Factors that came, in part, as a response to a return to more normal stock market volatility. Sentiment started the year in bearish territory but moved to bullish as evidence of excessive investor pessimism emerged (sentiment is a contrary opinion indicator). It has since moved back to neutral as the bounce off of the early year lows for the S&P 500 (most recently tested in April) has come with resurgent optimism.
Seasonal patterns moved from bullish to bearish as stocks have entered the seasonally weak period ahead of what is set-up to be tumultuous mid-term elections. Breadth has moved from bullish to neutral as the weakness off of the January peak led to deteriorating conditions and the bounce off of the lows has lacked the degree of the broad market participation that typically signals persistent strength.
The Macro Factors have not changed over the course of the first half of the year. Fed policy has remained neutral even as the Fed is signaling an accelerated path of rate hikes and global central banks shift from quantitative easing to quantitative tightening. Economic fundamentals remain bullish, and growth in the U.S. continues to accelerate. Valuations have improved somewhat as earnings growth has surged, but remain bearish and questions about the sustainability of earnings growth remain front and center heading into the second half.
We provide the ensuing charts not so much to provide answers to questions, but to provide insight about what we are watching and thinking about as the second half of 2018 unfolds.
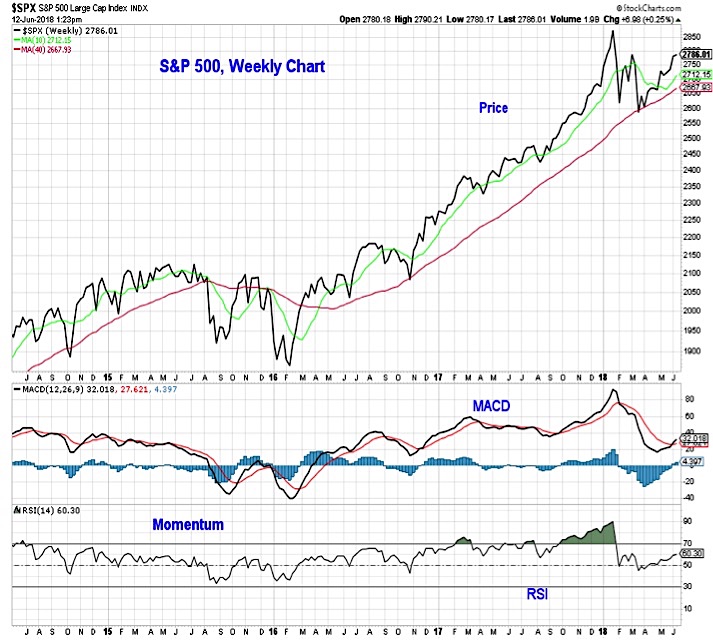
Whereas 2017 featured a slow and steady ascent for the S&P 500 (with the largest peak-to-trough decline in the index over the entire year being less than 3%), 2018 has featured an initial spike followed by an ongoing period of consolidation. Weekly momentum trends deteriorated as price worked lower but more recently has turned higher. Encouragingly, the RSI (Relative Strength Index) did not move much below 50 even as prices pulled back. This is consistent with a consolidation within the context of a longer-term bull market and would argue against viewing the first half of 2018 as the opening salvo in a lengthy bear market.
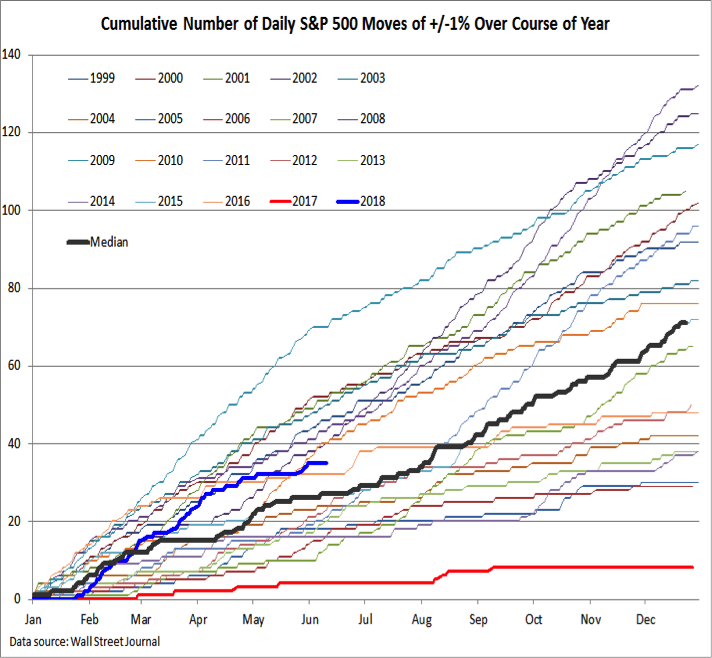
It might be tempting to categorize the volatility of 2018 as being uncharacteristic. The reality is that 2017, with its small peak-to-trough decline and less than 10 individual trading days on which the S&P 500 moved more than 1% in either direction, was an anomaly and 2018 has represented a return to more normal volatility. Thinking about it in terms of daily moves of 1% or more, 2018 is not far from the median experience of the past 20 years. If the pattern of the past holds, we could have as many 1% daily moves in the second half as we have seen in the first half of 2018 (35). In other words, the volatility seen in the first half is unlikely to meaningfully ebb in the second half.
The Federal Reserve has raised the Fed Funds rate twice already in 2018, and the projections it released at the June FOMC meeting indicate another two hikes are likely in the second half. At this point, rate hikes still represent a normalizing of interest rates and not moving monetary policy to the point of being restrictive. If the Fed’s expectations become a reality, normalization could be completed sometime in 2019. Additional rate hikes at that point would take the fed funds rate above its longer-run level.
Monetary policy right now is not only a function of interest rates, but also the size of central bank balance sheets. The Fed has already shifted from quantitative easing to quantitative tightening, and the ECB has announced plans to wind down its balance sheet expansion by the end of 2018. Over the past decade, stocks have done best when central banks have been aggressively expanding their balance sheets. As we move toward 2019, the slowing in the rate of balance sheet expansion could begin to weigh on stocks.
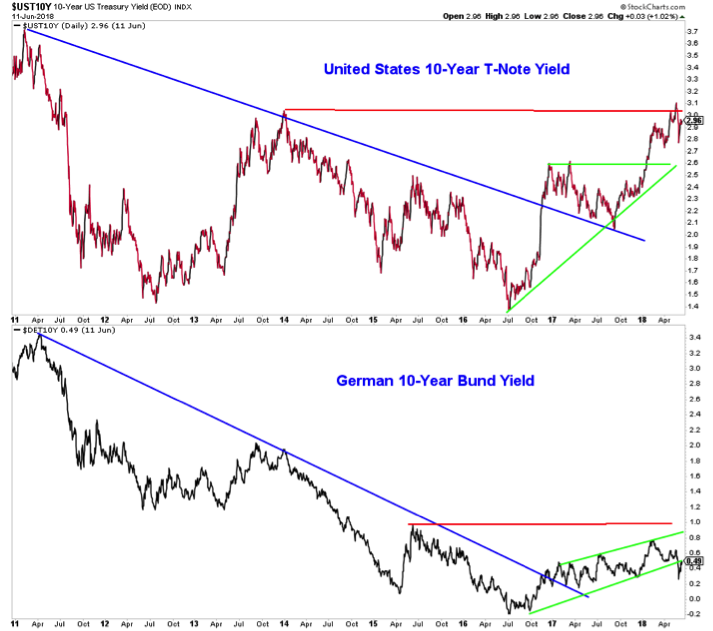
Rate hikes by the Fed have pushed up shorter-term bond yields, while yields for longer maturity Treasuries have been slower to respond. This has led to a dramatic flattening in the yield curve, as measured by the spread in yield between 10-year T-Notes and 2-year T-Notes. While an inversion in the yield curve (short-term rates moving above long-term rates) is seen as an ominous development and often a precursor to recessions, a flattening in the curve is typically more benign. An additional offset is that the flattening in the curve is coming as both short-term and long-term yields are trending higher. A flattening that comes with long-term yields moving lower as short-term yields rise could have negative implications for the economy.
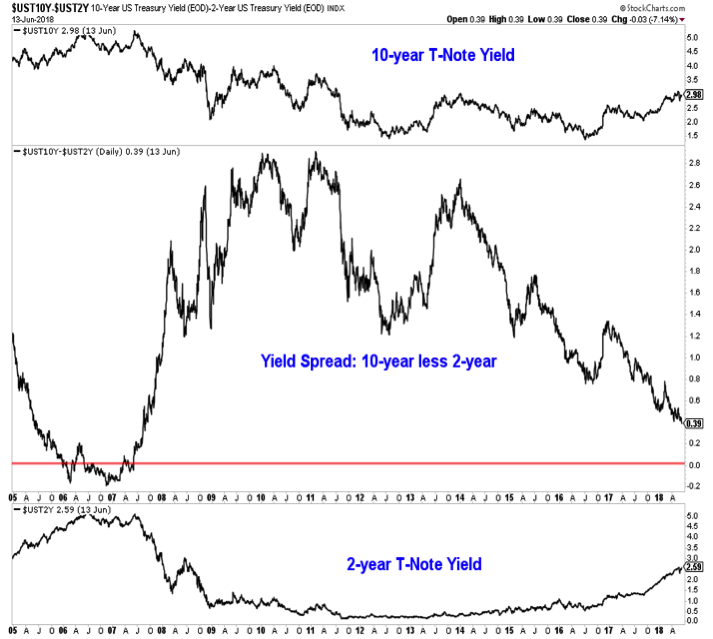
Looking back over the past two years, the 10-year T-Note yield has been trending higher. There is widespread pessimism in bonds right now, as many investors and forecasters are looking for a continuation of this trend. Yields may move higher over time, but the next move in the near term may be to re-test the 2.6% level. Not only has sentiment gotten excessively one-sided on bonds, but the most recent rise in T-Note yields was not confirmed by a similar rise in yields on the German Bund.
Supporting the Fed’s decision to continue to normalize interest rates and the overall trend higher in bond yields is evidence that the U.S. economy remains on firm footing. Looking at data through the first quarter, year-over-year growth in both nominal and real GDP is expanding and in both cases it is moving toward the top of its recent range. Second-quarter growth has accelerated over the pace seen in the first quarter, and real-time estimates have been moving higher over the course of the quarter.
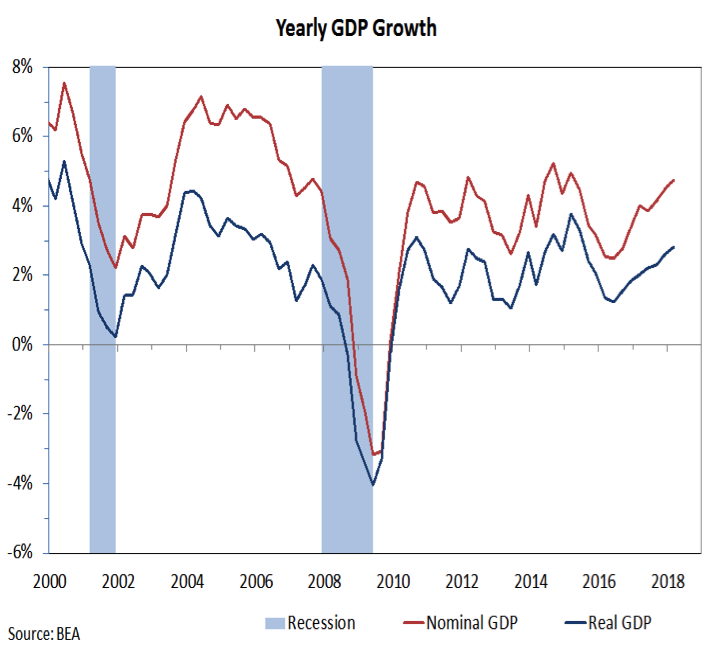
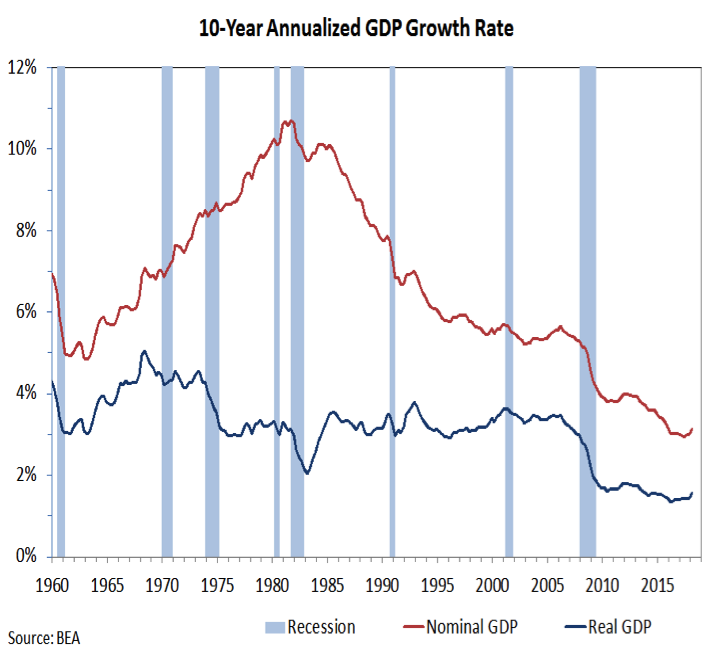
Looking at 10-year growth rates, it is easy to see why there has been so much talk of secular stagnation when it comes to growth. Growth rates for both nominal and real GDP have been at or near their lowest on record. A closer look, however, allows for a more hopeful conclusion. The uptick in the yearly growth rates seen over the past two years has helped push the 10-year growth rates slightly higher. If this continues, it will turn out that widespread talk of secular stagnation emerged at or near a generational nadir in growth. Supporting this hopeful view is the recent up-tick in real median household incomes (which also bottomed in 2013).
There is ample evidence that near-term economic conditions remain strong. Retail sales moved to a new all-time high in May, Purchasing Managers Indexes remain elevated, and the labor market has shown surprising strength in terms of both payroll growth and declining unemployment rates. If overall growth is going to make a secular shift higher, it may require filling the record number of job openings. This is likely more than just a question of finding the right wage and likely goes to a need to provide job training (or re-training). Evidence of worker confidence can be seen in the continued move higher in the number of workers voluntarily quitting jobs (presumably for better opportunities elsewhere).
Economic optimism remains elevated and the unleashing of long-dormant animal spirits could help provide the economy with much needed upside momentum. Optimistic small business owners are typically more willing to expand their business, hire workers and take entrepreneurial risks. These are some of the ingredients that can spur accelerated growth over an extended period of time.
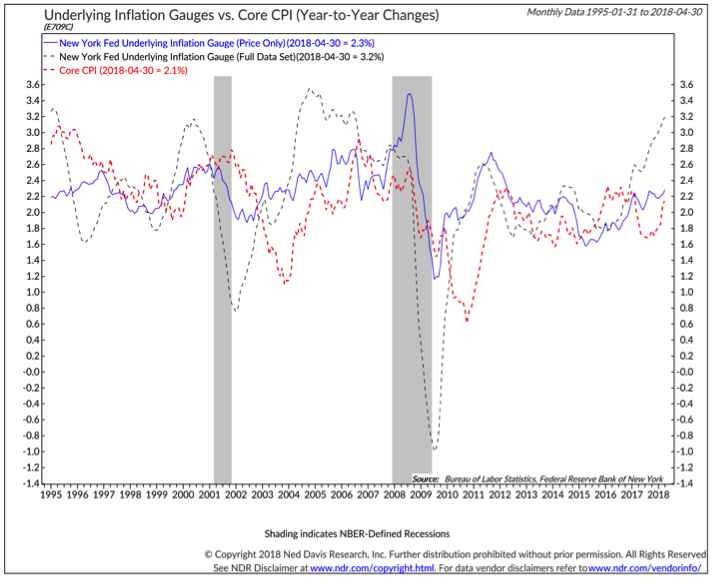
While growth is accelerating, we have also witnessed evidence of increased inflation pressure. If this continues, it may prompt the Fed to remain in a tightening mode even after reaching a neutral Fed Funds rate. The Underlying Inflation Gauge calculated by the New York Fed has moved to its highest level in a decade, which sounds ominous. But given the overall lack of inflation experienced in that time period, this may actually just signal a return of a more historically normal economy and the price dynamics that accompany that.
One of the pressing questions we are considering is the degree to which the price volatility of the first half, coupled with robust earnings growth, has relieved the valuation excesses that have emerged in recent years. The good news is that Value Line Price/Earnings ratio (which uses a blend of trailing earnings and forward earnings) has pulled back from its all-time high. The not-so-good news is that there is more work to be done before valuations are no longer considered a headwind for stocks. Continued earnings growth and an uptick in price volatility in the second half of 2018 could help in this regard.
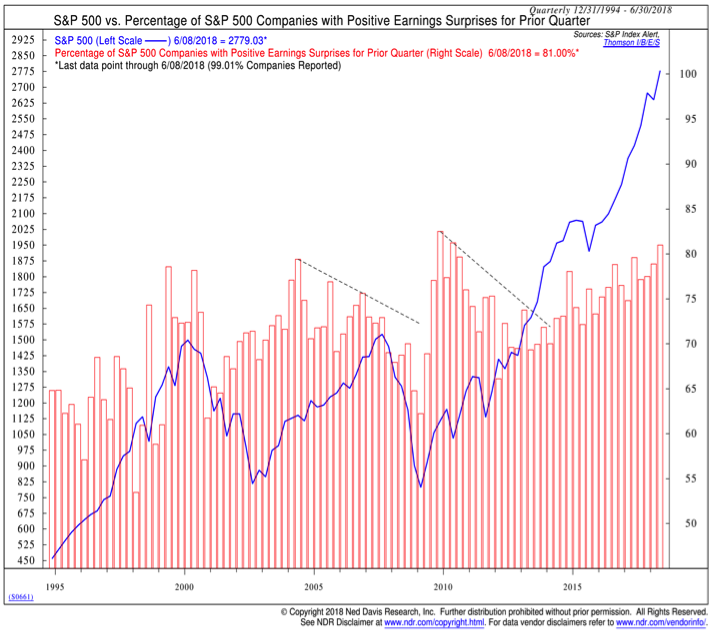
Even though earnings expectations were elevated coming into the first-quarter earnings season, companies were still able to provide upside surprises. Both revenue growth and earnings growth were strong, and more than 80% of companies had positive earnings surprises. A risk in the second half is that the pace of earnings surprises slows. When that has happened in the past, stocks have tended to struggle.
In addition to watching for upside surprises during earnings season, we will also be watching the overall direction of earnings estimates. So far, the upside surprises in the first quarter have not translated into meaningfully higher estimates for the remaining quarters of 2018. Earnings estimates for the second quarter have held stable, but that alone breaks the pattern of seeing estimates move lower over the course of the first two months of the quarter. This marginal improvement may be enough to break the pattern that shows up in the yearly earnings estimates in recent years (wherein estimates have started high and worked lower over the course of the year).
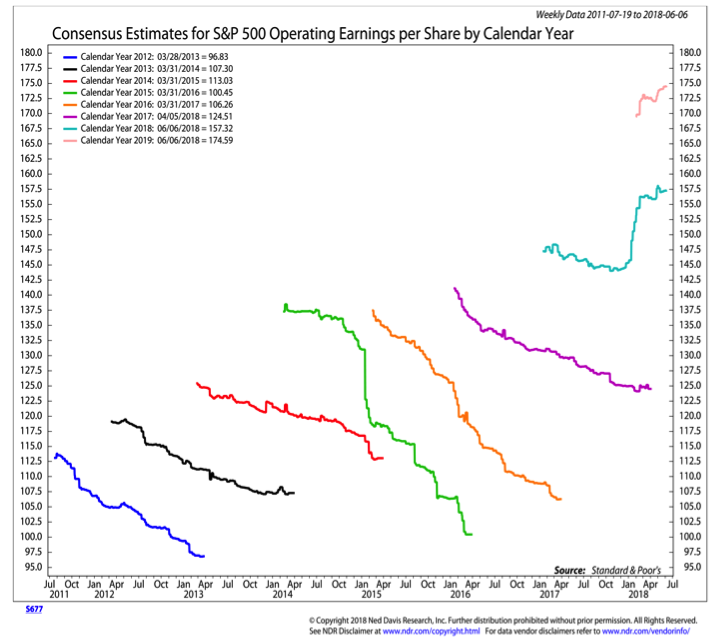
While directional improvements in earnings estimates may be a positive sign for stocks, it would come at a time when earnings estimates are already high. Stocks tend not to do well when earnings forecasts are as elevated as they are now. The first quarter provided some evidence of this. Even though there were widespread upside earnings surprises, expectations were already elevated (just not elevated enough) and that led to a relatively muted stock price reaction to upside surprises.
These elevated expectations for earnings come at a time in the economic cycle when profit growth tends to slow. With tax reform providing a tailwind and the potential of a secular acceleration in growth offsetting some cyclical tendencies this may not be a concern that is fully realized. However, earnings expectations are high and the first quarter saw the record corporate profit margins at a time when there is evidence that both commodity and labor costs are starting to rise.
The weekly sentiment surveys show the emotional roller coaster that investors went on over the course of the first half. We went from record optimism to start the year to a near-term washout early in the second quarter followed by resurgent optimism heading into mid-year. The recent buildup in bullish sentiment does not mean that stocks need to immediately weaken, but it does suggest that risks are rising and that many investors could be uncomfortably impacted if volatility rises in the second half.
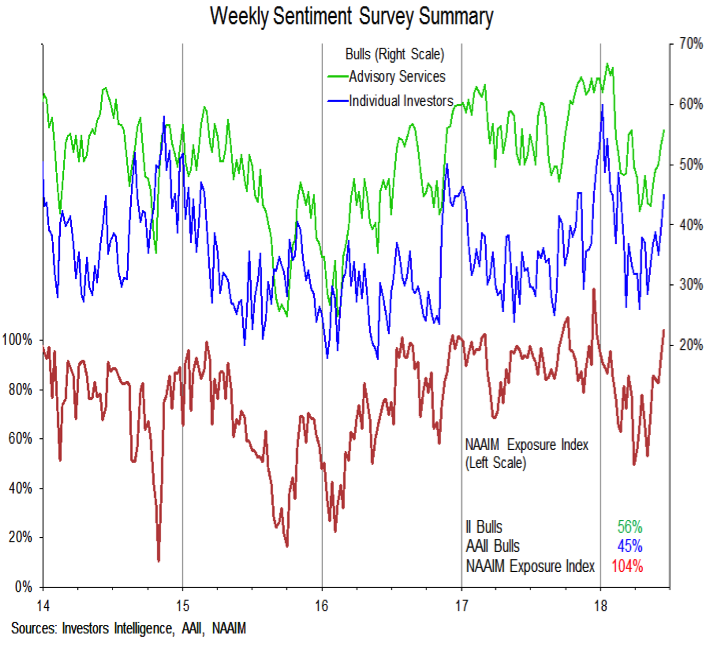
From a short-term perspective, the NDR Daily Trading Sentiment Composite has moved above the peak seen in January (the weekly sentiment survey indicators are still shy of their recent peaks). All of the net gains for stocks over the past three and half years have come when this indicator has signaled extreme pessimism. The recent re-emergence of excessive optimism argues for near caution.
Optimism is not only showing up in the sentiment surveys, but also in equity fund flows. Reflecting the volatility of the first half of 2018, fund flows have oscillated between excessive outflows (which are bullish) and excessive inflows (which are bearish). Right now, investors are tilting back toward equities, perhaps excessively so.
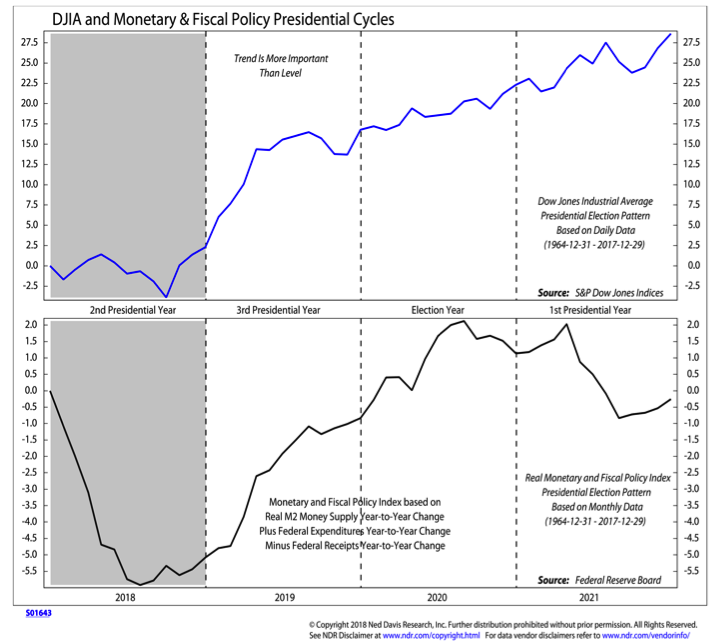
Stocks historically struggle to rally heading into mid-term elections. This can be due to the uncertainty of election outcomes, but may also reflect headwinds associated with the policy backdrop. With the speaker of the house (Wisconsin’s own Paul Ryan) already announcing that he is not running for re-election, there could be new leadership in Congress even if Republicans hold on to control of the House of Representatives (which is uncertain at this point).
The good news from a seasonal perspective is that after we get through the mid-terms, seasonal patterns turn more favorable and are a tailwind for stocks heading into 2019.
The six months prior to mid-term elections have historically been an especially bad time for small-cap stocks. So while small-caps have led the bounce in the first half and have moved to new highs, they are contending with significant seasonal headwinds. While this time may indeed turn out to be different, that appears to be a high risk proposition at this point.
Key evidence that the consolidation phase of the first half is moving toward completion will likely come from the breadth data. We are looking past new highs in various advance/decline lines in large part because they are best used as evidence of divergences at turning points, rather than confirmation of the continuation of a trend. Additionally, in both 2011 and 2015, the advance/decline line for the S&P 500 peaked after the index.
We are watching the percentage of industry groups in up-trends and while still less than robust, this indicator has been improving as the S&P 500 has rallied. At this point, breadth is not providing a divergent signal from price, but it is also not signaling more strength beneath the surface.
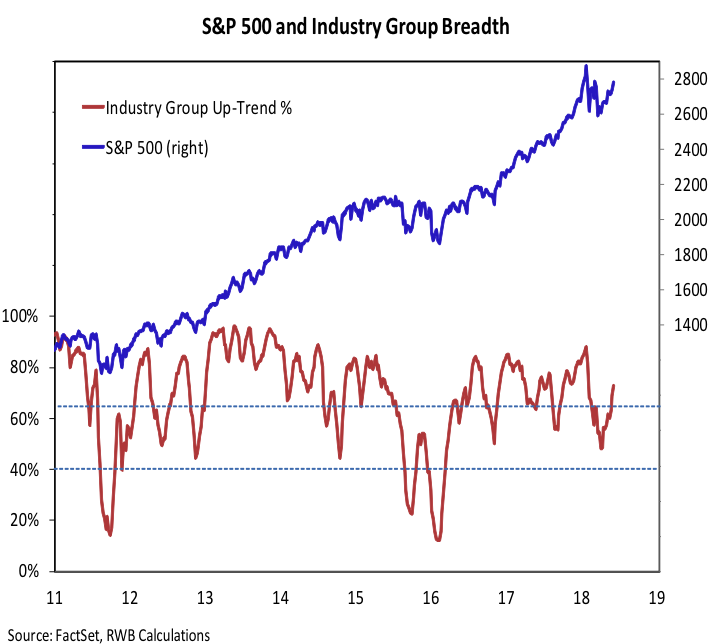
Our expectation is that the market itself will provide evidence that consolidation is yielding to the resumption of a sustainable up-trend. One way that it has historically signaled that is through the emergence of so-called “breadth thrusts.” The early year weakness brought intense periods of selling, but the rallies have been less than robust in terms of buying. While the indexes can get back in gear without signaling a breadth thrust, rallies that emerge in those contexts tend to be more short-lived. In addition to looking for extremes levels in the 10-day advance/decline ratio (shown here), we are also monitoring the percentage of stocks trading above their 10-day averages and are looking for daily trading where upside volume outpaces downside volume by better than nine-to-one.
Current leadership trends show small-cap groups with better relative strength than either mid-caps or large-caps. If the typical small-cap weakness ahead of mid-terms is going to emerge, large-cap groups should begin to improve and ultimately move into the top spots in the rankings. From an industry group leadership perspective, we are seeing strength in Retailing, Health Care Equipment & Services, and Real Estate. Relative weakness is seen in Household & Personal Products, Pharmaceuticals, Telecom Services, and Utilities.
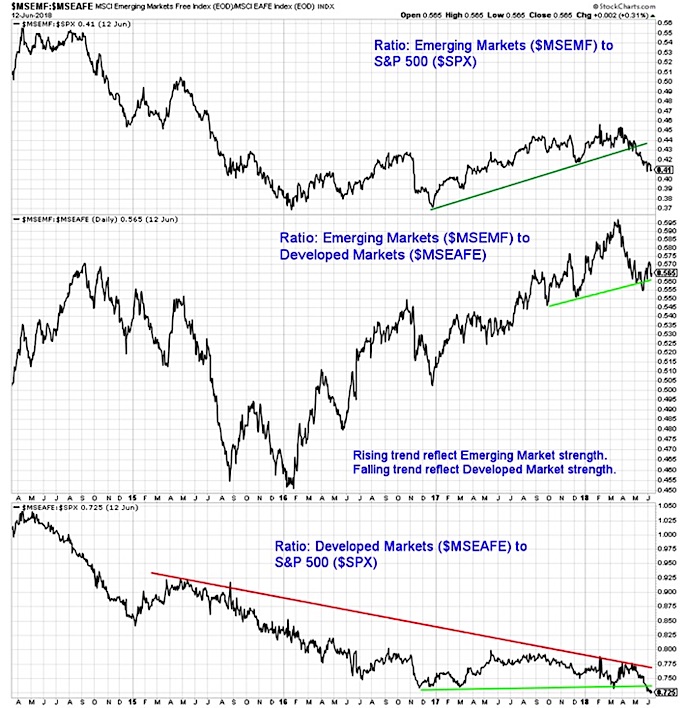
In terms of global leadership, U.S. stocks (using the S&P 500 as a proxy) have gained strength relative to both emerging markets and international developed markets. The longer-term trend favoring emerging markets over developed markets remains largely intact, although emerging markets have lost a step recently.
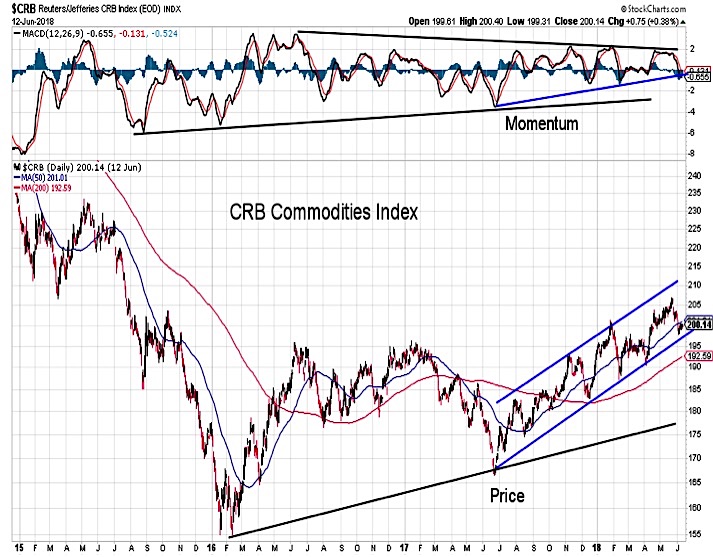
Beyond equities, commodities have emerged as an area of strength over the past year. Since bottoming in mid-2017 the CRB commodities index has trended higher within a well-defined channel. Moving toward mid-year, commodities are resting near support from both a price and momentum perspective.
Twitter: @WillieDelwiche
Any opinions expressed herein are solely those of the author, and do not in any way represent the views or opinions of any other person or entity.


