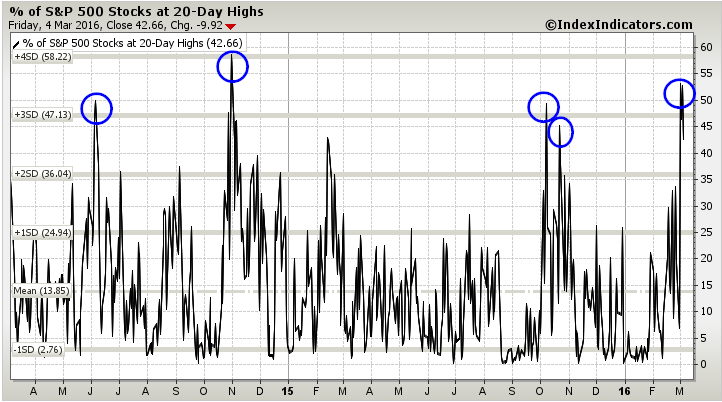
Notice the recent spike in the percentage of S&P 500 stocks at 20-day highs. Also notice that when previous spikes reversed, they generally reversed quickly.
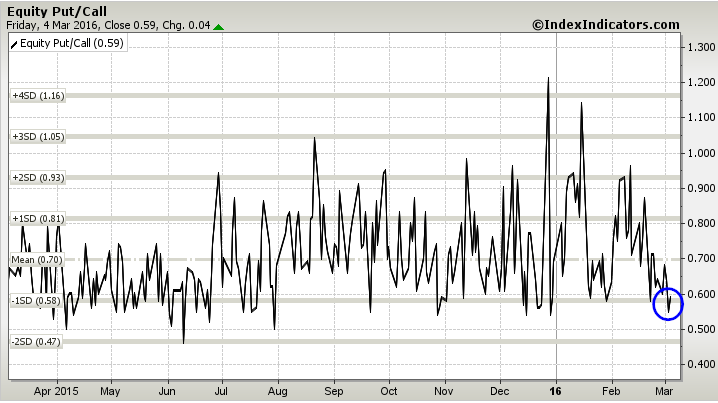
Another popular tool is the equity put/call ratio, which currently sits near the lower end of its range at 0.59.
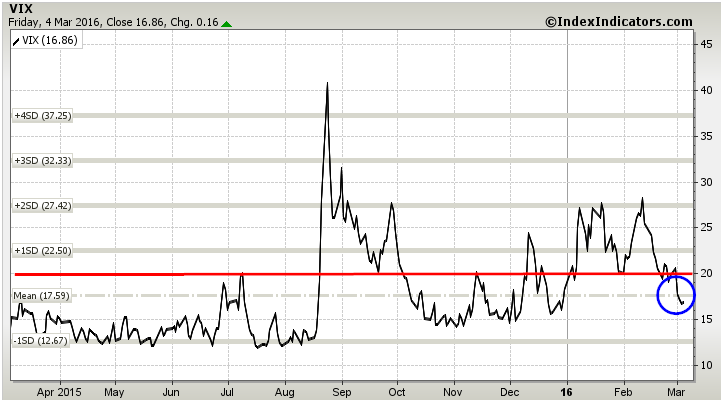
The CBOE Volatility Index (aka the VIX) has now fallen back below 20 after spiking above 30 earlier this year. The VIX closed Friday at 16.86.
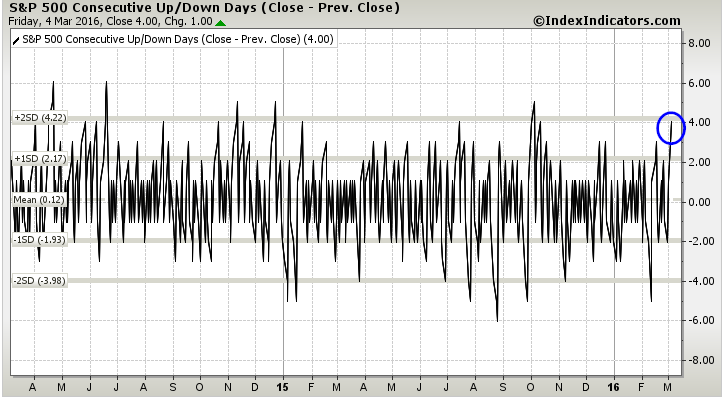
On Friday, the S&P 500 closed up for the fourth consecutive day. On a shorter-term basis, the consecutive up days in the S&P 500 has now reached two standard deviations (see chart below). Clearly, we are due for some digestion and some consolidation of gains.
Finally, notice that the rolling 15 day (or approximately 3 week) return for the S&P 500 is now above the high from 2014.
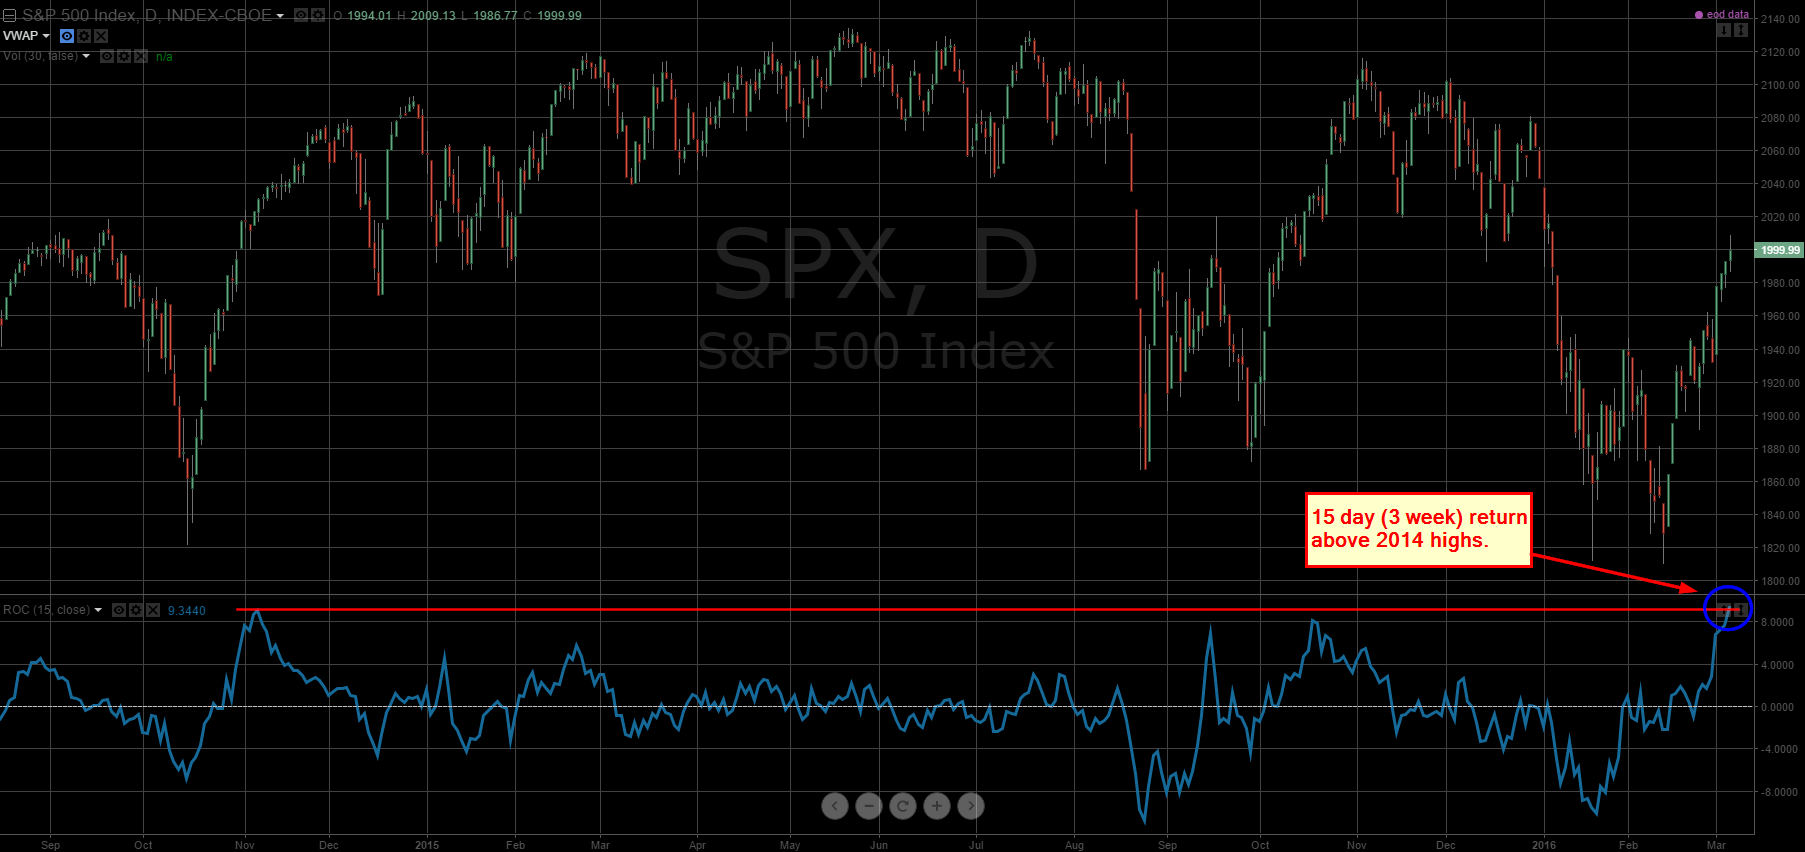
Collectively, these indicators tell me that the recent rally has been a much broader-based rally supported by improving breath. While these indicators may suggest the market is currently overbought on a shorter-term basis, there is little to suggest – as of now – that we are about to turn back lower. A pause, either in time or in price, would be expected at this point.
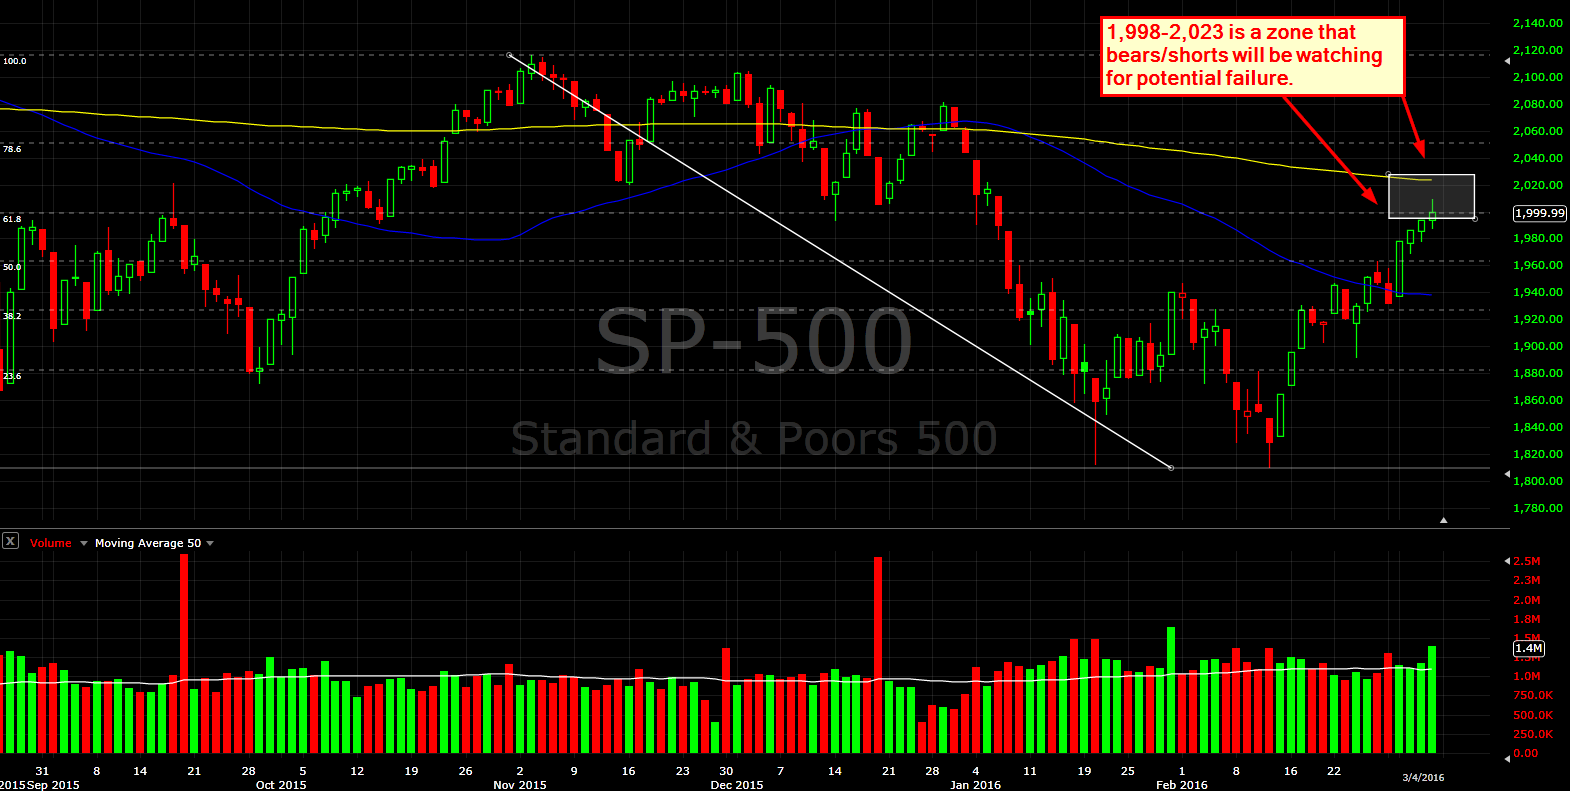
However, when you compare multiple timeframes, there is a clear conflict in terms of trends. First, as you can see on the daily chart of the S&P 500 below, price is above the blue 50-day moving average (a measure of the intermediate trend) while below the yellow 200-day moving average (a measure of the long term trend). Also, notice that both the 50-day moving average and the 200-day moving average are now about flat to slightly downward sloping. This indicates a trendless market in the both the intermediate term and long term, which makes failed breakouts and mean reversion more likely. This is yet another reason that investors may be skeptical of the recent rally in the stock market.
While the market may be more neutral on an intermediate basis, when you zoom out to the longer timeframes, there may be some things that make you cautious. For example, the chart below is a monthly chart showing just the 10-month simple moving average along with the 20-period simple moving average with price removed. As you can see, the 10-month moving average just recently crossed below the 20-month moving average, something it hasn’t done since 2008 and 2001.
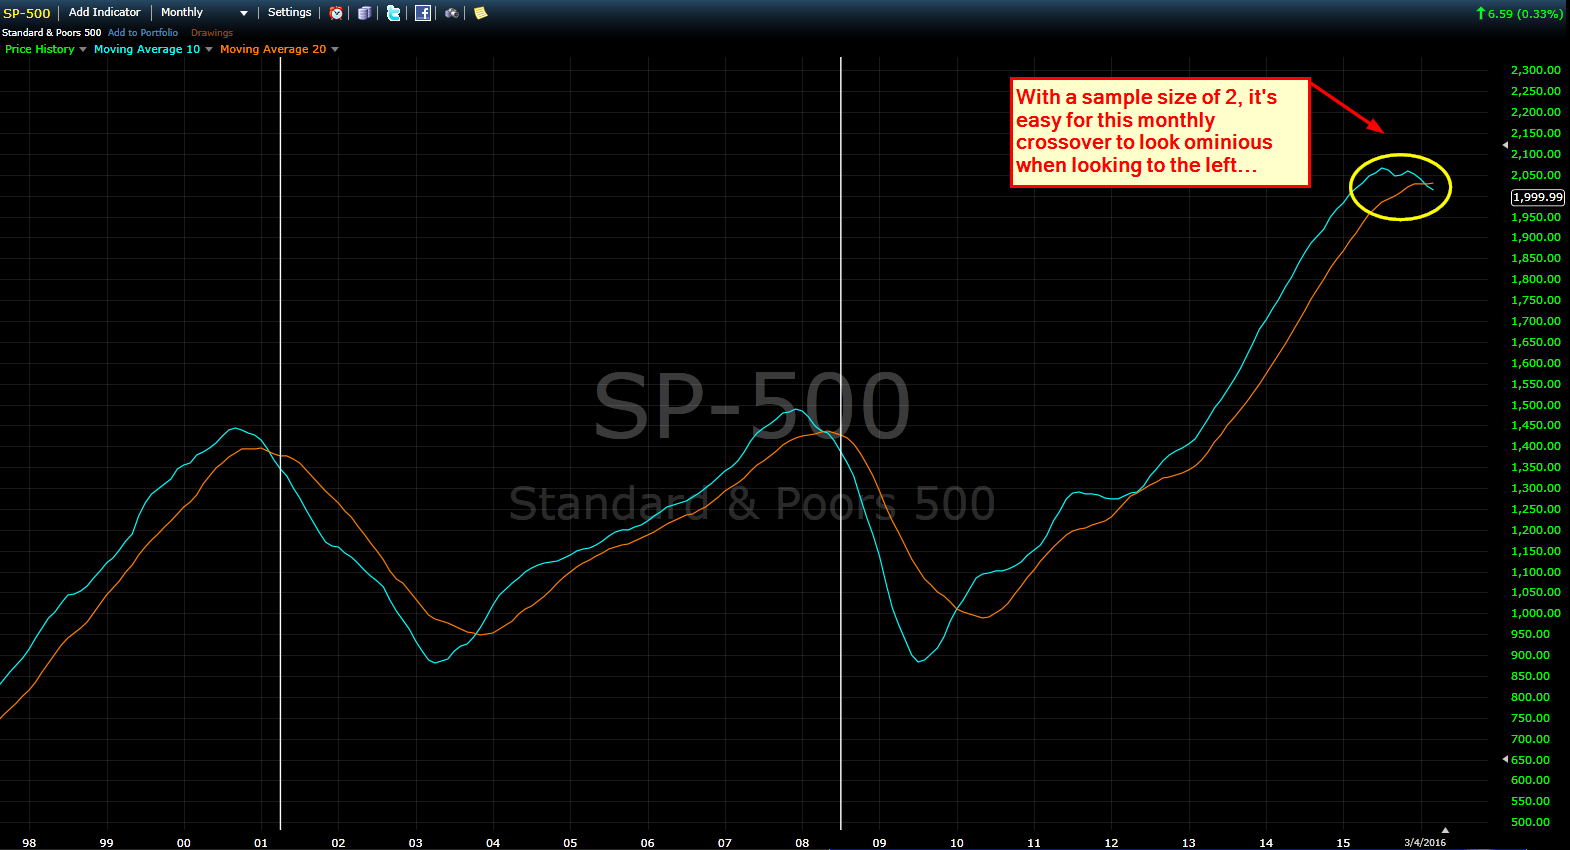
Now, I’m not sounding the gloom and doom alarm because of this one crossover (above). This has only occurred twice in the 21st century. With a sample size of two, it becomes easy for the monthly crossover to look ominous, especially when comparing it to what happened previously. Personally, this just highlights the contradiction on different timeframes I’m seeing right now. Moreover, when you have timeframe contradiction like this, it becomes much more important for you to know your timeframe and who you truly are as a market participant. Are you a long-term investor actively allocating funds to your retirement account? Are you an intermediate-term swing trader? Are you a trend-follower? Are you a mean-reversion trader? Are you an active, intraday trader? Your answer will dictate the significance of the different trends presented above.
I’m not going to predict what happens next in the market or whether or not “the lows” are in. Personally, I think we will begin to find a new range in the market, perhaps overshooting to the upside. Ultimately, I believe it will take time for this large range to be resolved, up or down. Whenever that eventually happens, I’ll be sure to share my thoughts. Until then, trade well.
Thanks for reading. Please let me know if you have any questions or comments.
Twitter: @MarketPicker
Any opinions expressed herein are solely those of the author, and do not in any way represent the views or opinions of any other person or entity.


: Showing Some Signs of Emerging Strength")
