One of the most important functions in my research is tracking sector performance. It is deeply imbedded into my broader macro work, as I find that drilling down into each sector allows me to gauge the overall health of the financial markets. It also assists me in locating areas of the market that I want to focus my investment strategies on. For more on my approach and to read my other 2015 sector outlook posts, click here.
This post will focus on the Materials Sector and Energy Sector. As this is intended to provide a yearly outlook, the longer-term charts will drive my views as well as filter out some of the near-term noise. Lastly, the use of sector ETFs eases the implementation of any investment strategies one might see fit. Note the Materials and Energy sectors can also be tracked and traded via Materials Sector SPDR (XLB) and Energy Sector SPDR (XLE).
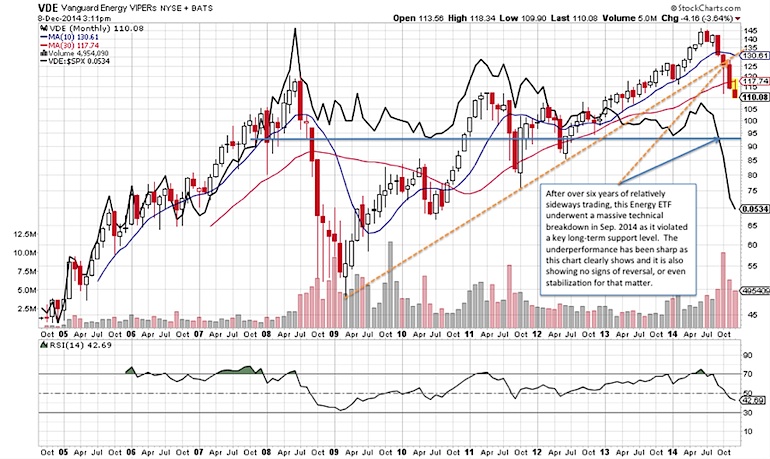
Energy Sector – Vanguard Energy ETF (VDE)
After over six years of relatively sideways trading, this Energy sector ETF underwent a massive technical breakdown in Sep. 2014 as it violated a key long-term support level. The underperformance has been sharp as this chart clearly shows and it is also showing no signs of reversal, or even stabilization for that matter. From a price perspective, one can also see the violation of the major 2009 uptrend line. This is what one may refer to as some severe technical damage that needs to be repaired. In other words, there are a number of things that need to occur to make this a safe playground for investors. Traders may attempt to bottom fish for an oversold rally, but a disciplined style to ones risk management and profit expectations must be drafted before trades are place, in my opinion.
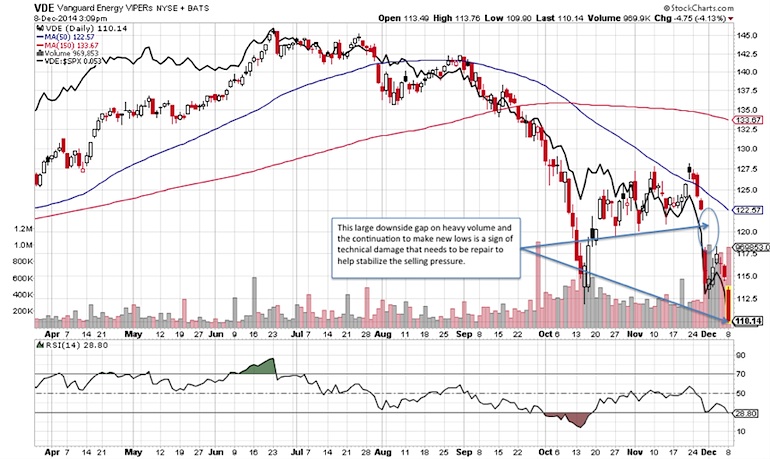
Below are some near-term signs of the technical damage that need to be repaired before the selling pressure is to stabilize.
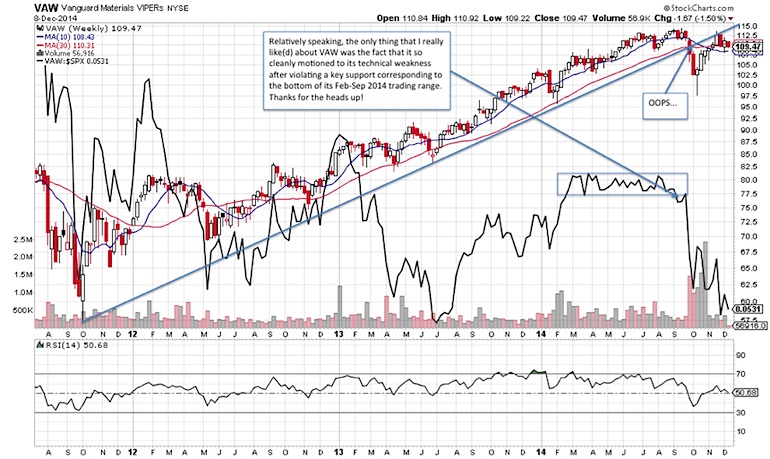
Materials Sector – Vanguard Materials ETF (VAW)
Relatively speaking, the only thing that I really like(d) about VAW was the fact that it so cleanly motioned to its technical weakness after violating a key support corresponding to the bottom of its Feb-Sep 2014 trading range. The Sep. 2014 violation of its 2011 uptrend line and the subsequent cross of the 10-week ma below its 30-week ma add further weight to this sector ETF setting up to underperform in the year ahead.
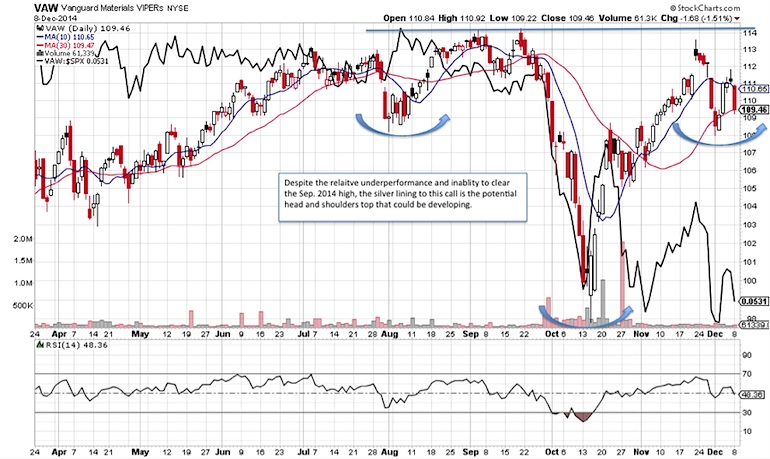
VAW is one of the few sector funds here that is still trading below its Sep. 2014. Will VAW continue to lag? It appears that way, but the silver lining here is that there is a potential fairly significant head and shoulders bottom pattern that could be developing, which will need to be watched as the potential “game-changer”. Neckline resistance would be near the Sep. 2014 high of 114.25. A convincing breakout along with a change in relative strength could indicate the emergence of new leadership. Until then, caution is still advised.
To conclude, I’d like to remind you that sector rotation is something that occurs and we should be mindful of (especially with the steep drop in energy). As well, rising and falling leaders will emerge and disappear, but until the dominant technical trends that I have highlighted here show signs of failing I will to follow the trend and adjust accordingly. Should signs of technical weakness/strength change the charts enough to alter my outlook, well, then my outlook will alter as necessary. That’s the beauty of technical analysis! Thanks for reading.
Follow Jonathan on Twitter: @jbeckinvest
No position in any of the mentioned securities at the time of publication. Any opinions expressed herein are solely those of the author, and do not in any way represent the views or opinions of any other person or entity.

: Cup (and Maybe Handle) Watch")
 Reaches Important Price Support")

