With interest rates rising and bond prices falling, the treasury bond market is gathering a lot of interest.
Today we use technical analysis to look at the 20+ Year US Treasury Bond ETF (TLT).
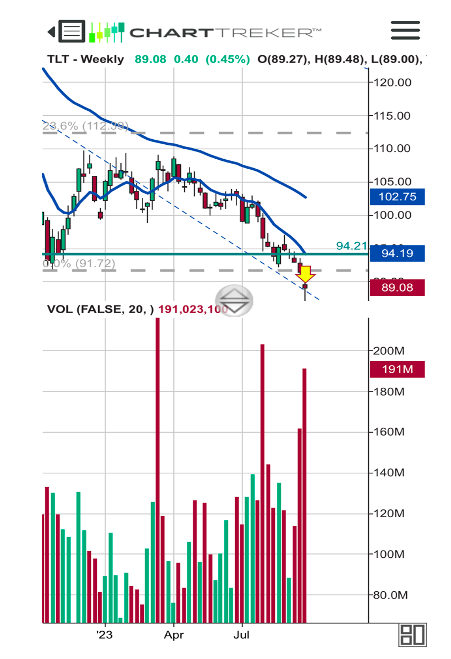
TLT (weekly) – A hammer will form at end of day if long-term Treasuries close near the high.
Hammer – Technical perspective that the bulls, after an extended battle with the bears, have gained control of territory (price level). Could this price level be the last stand? I believe so.
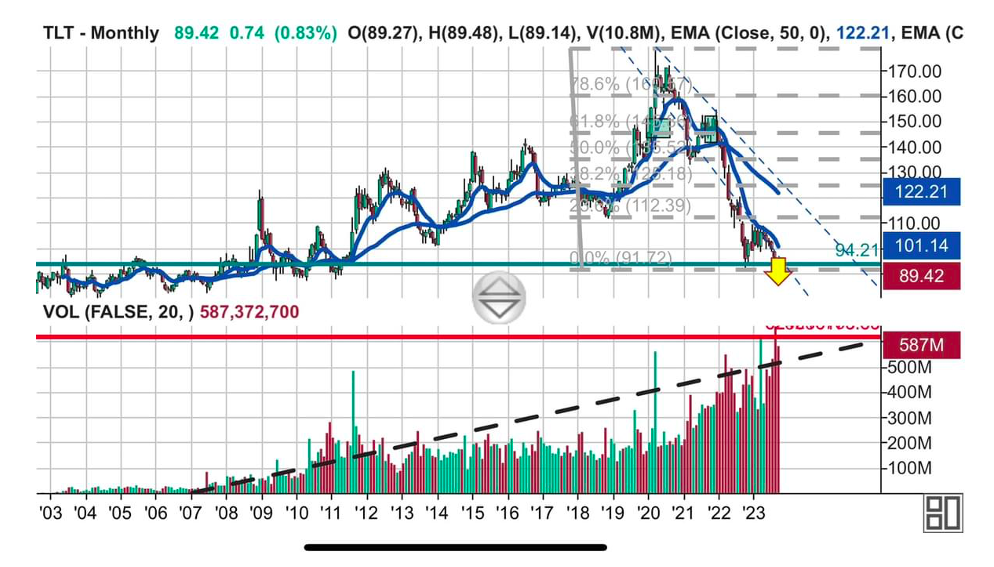
TLT (monthly) – A look back in time shows that this price level is one to not ignore. Psychologically, this level has a long and sordid history for traders. Many bears have found themselves on the wrong side of the trade here. People don’t forget this kind of loss.
From an economic perspective, this is the price level that has proven unsustainable for Main Street (consumers and business). Price of bonds and interest rates have an inverse relationship. Consumer borrowing costs are often pegged to the 10-year.
Volume – volume over time is a testament to the drama of where we are. US Treasuries are supposed to be a boring trade, and yet notice the volume indicating growing outsize interest. This should be no surprise given Fed’s central role in the aftermath of the global Financial Crisis (2008 – 2012).
Twitter: @seeitmarket
The author may have positions in mentioned securities at the time of publication. Any opinions expressed herein are solely those of the author, and do not in any way represent the views or opinions of any other person or entity.
Editor’s note (October 1, 2023): Corrected grammar by changing word “lost” to “loss”.


