Bonds have traded in a wide, yet contained range. And the latest move higher in bond prices has seen bond yields (opposite) drop.
The move lower in bond yields has consumers optimistic about falling auto and home loan interest rates.
BUT this theory will be tested very soon.
Today, we look at a chart of the 10-Year US Treasury Bond Yield and highlight an important support area to watch in the days ahead.
Note that the following MarketSurge charts are built with Investors Business Daily’s product suite.
I am an Investors Business Daily (IBD) partner and promote the use of their products. The entire platform offers a good mix of tools, education, and technical and fundamental data.
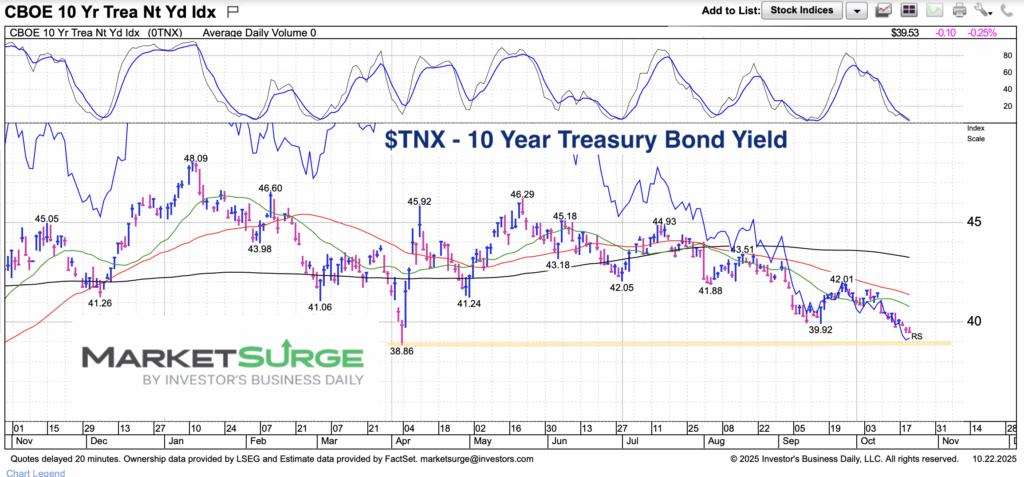
$TNX 10-Year US Treasury Bond Yield Chart
Here we can see that the 10-Year yield has fallen below 4.0% and is currently testing the April low. Should this level break, then consumers would be rewarded with even lower interest rates. However, it’s worth noting that falling interest rates (if too far) can signal a slowing economy.
Twitter: @andrewnyquist
The author may have a position in mentioned securities at the time of publication. Any opinions expressed herein are solely those of the author, and do not in any way represent the views or opinions of any other person or entity.

: Showing Some Signs of Emerging Strength")
