All Eyes On That 10 Year Treasury Yield…
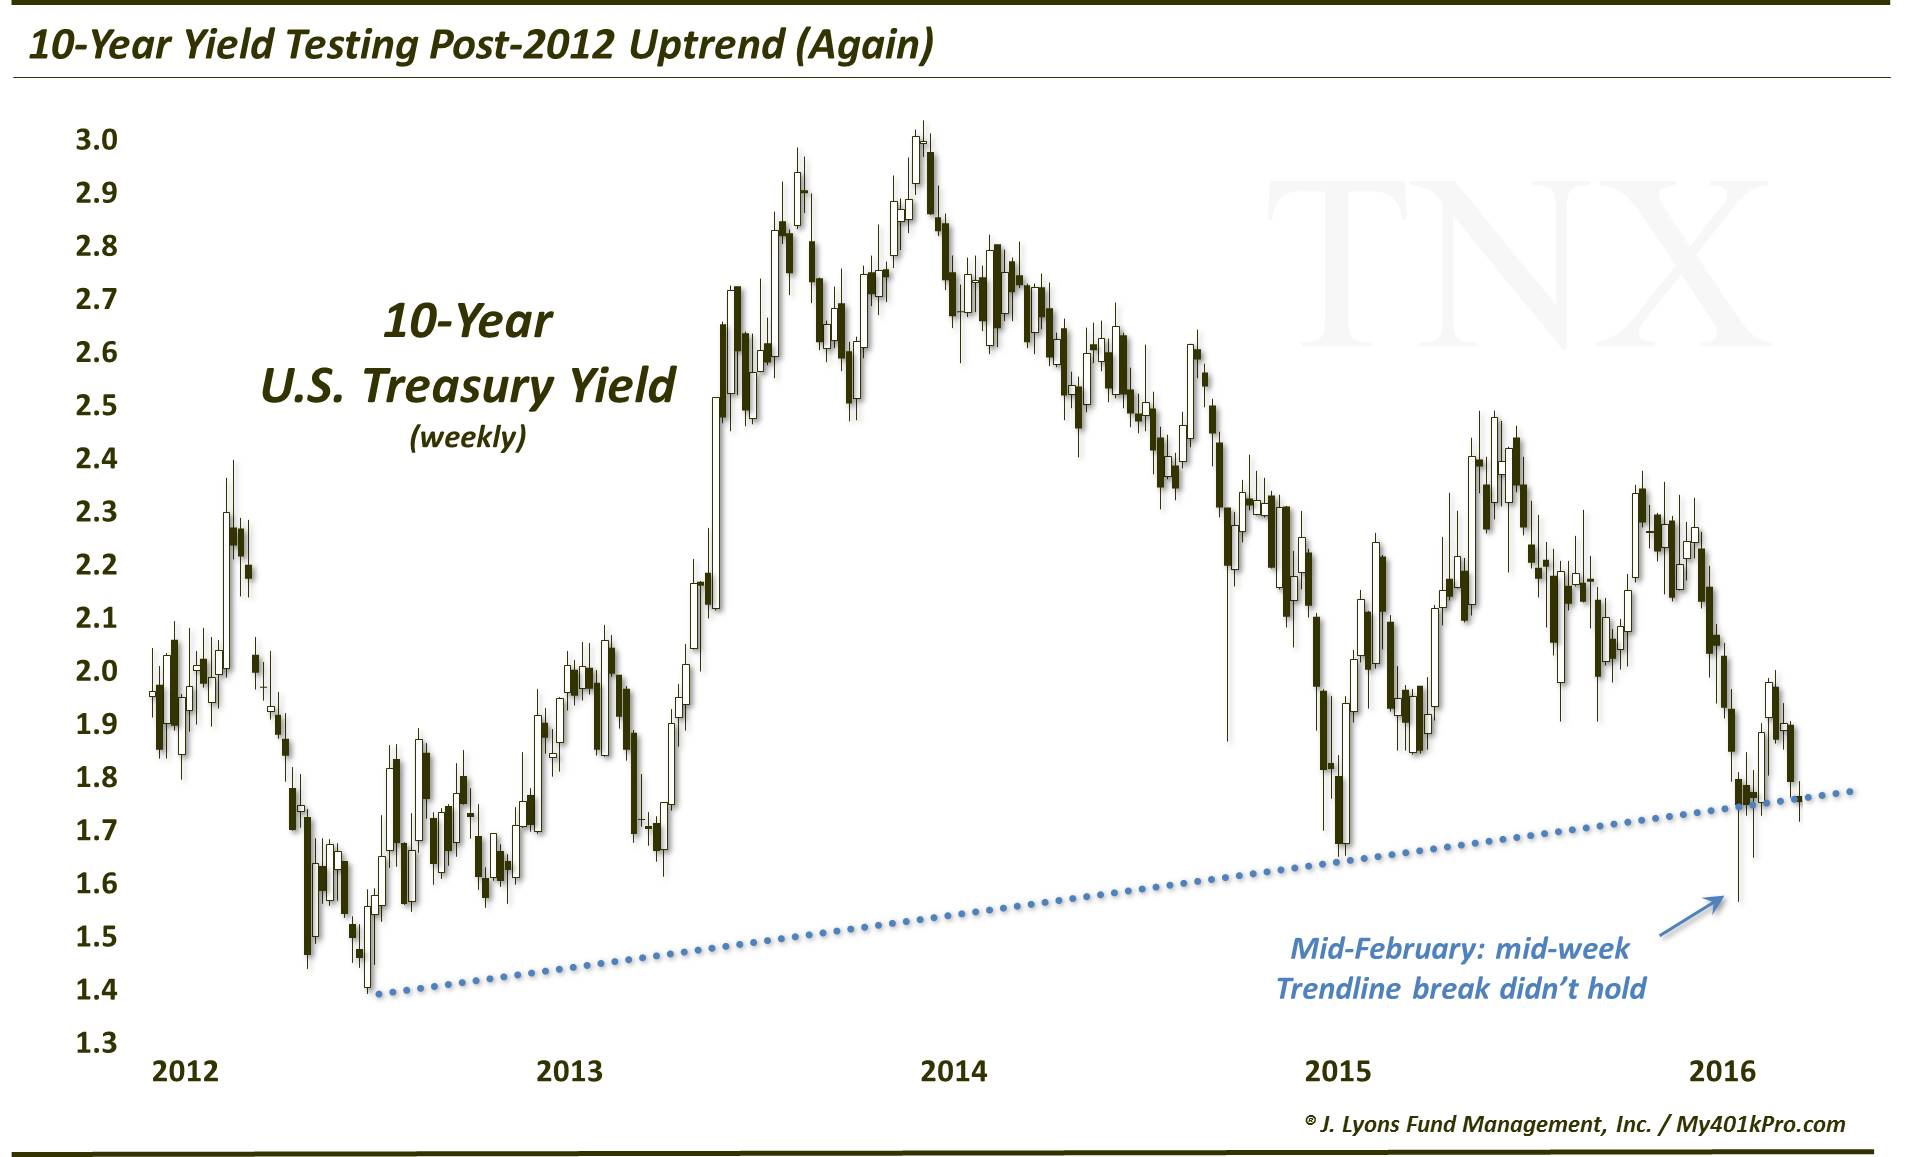
In mid-February, we posted a chart on the U.S. 10 Year Treasury Yield as part of our “Trendline Wednesday” Twitter series. The chart, in effect, stated that the 10-Year was “breaking” its post-2012 uptrend. If only we had decided to go with a “Trendline Friday” feature instead.
That’s because by the close that following Friday, the 10-Year Treasury Yield had reclaimed the considerable declines that had been in place mid-week. Thus, on the weekly chart, there technically was no breakdown, on a closing basis.
Again yesterday, we posted a chart of the 10-Year Treasury Yield dropping below the trendline and pondered is the 10-Year Yield breaking its uptrend for real this time? Well, once again it may have been too soon to make that proclamation as the 10-Year Yield jumped yesterday by enough to reclaim the uptrend… again.
Thus, if one is focused on a potential further breakdown in the 10-Year Treasury Yield — for whatever reason, e.g., a dovish Fed, a slowing economy, etc. — it may be most prudent to view the developments using a weekly chart.
Thanks for reading.
More from Dana: “Has The Stock Market Rally Made Investors Complacent“
Twitter: @JLyonsFundMgmt
Any opinions expressed herein are solely those of the author, and do not in any way represent the views or opinions of any other person or entity.

 Testing Important Price Support")
: Cup (and Maybe Handle) Watch")

