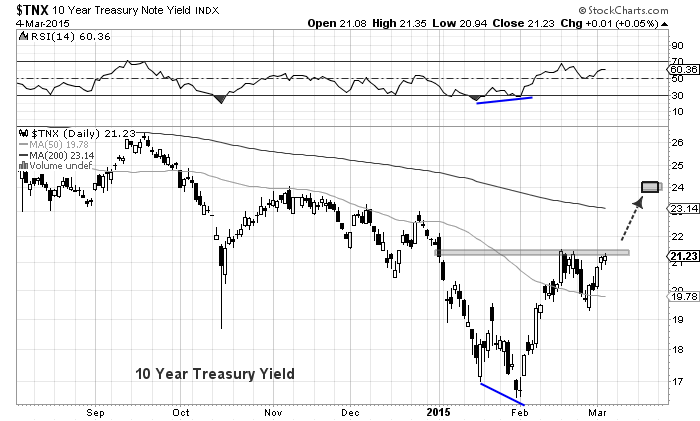
After bottoming on January 30th, the 10 Year Treasury Yield (TNX) rallied sharply along side equities for much of February before pausing into March. That rally was set up by an RSI divergence and an undercut of the lows. The recent pause following the rally has taken the shape of a classic consolidation “handle”. But with the February NFP Jobs Report coming on Friday, that could be too “easy”.
So how should we attack the chart as traders? From a technical vantage point, the 10 year treasury yield definitely looks like it wants to go higher. But how that happens isn’t always clean and neat… and sometimes it doesn’t happen at all. IF the 10 Year treasury yield is going to go higher, it will need to take out 2.15 (21.50) – call that the trigger. That level represents the February 17th’s high as well as the January 2/5 gap lower at the beginning of the year (which was recently filled). Either way, it’s resistance. And if/when yields drive through that level, they could make a measured move targeting as high as 2.43 (24.30).
10 Year Treasury Yield Chart
Fellow trader and technician Jeff York (@mpgtrader) also sees this target area as a potential price magnet with his pivot system. He highlighted 2.36 in this March 3rd tweet:
$TNX the 10yr. closed at 2.12 today. Pivot point analysis shows the yearly(P) pivot @ 2.36 is the next target. pic.twitter.com/4xKXoTDycp
— Jeff York, PPT (@mpgtrader) March 4, 2015
Trade safe and thanks for reading.
Follow Andy on Twitter: @andrewnyquist
No position in any of the mentioned securities at the time of publication. Any opinions expressed herein are solely those of the author, and do not in any way represent the views or opinions of any other person or entity.

: Worrisome to Broader Market?")


