The jittery bond market has been on edge for the last seven months as rising interest rates have put a lid on nearly every sector except floating rate notes and high yield.
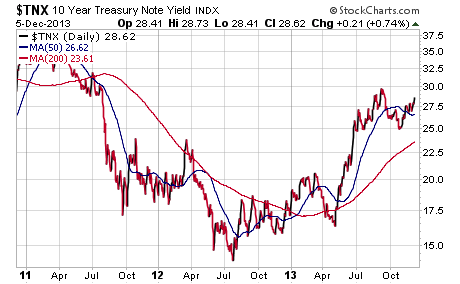
The threat of the Federal Reserve putting an end to its latest round of quantitative easing has pushed the 10 Year Treasury Note yield back above 2.8%. It’s yield is once again drifting towards the high of 3.0% that we witnessed back in September.
A quick look at a 3-year chart of the 10 Year Treasury Note Yield (TNX) shows that we haven’t been at these levels since mid-2011, which coincided with the end of QE2. Interestingly enough, it was an end to intervention in the bond market that led to a decline in yields and rally in bond prices that year. Conversely, stocks fell during that same time period as investors swapped their equities for high quality bonds such as the iShares 20+ Year Treasury ETF (TLT).
I am currently operating under the thesis that if the Federal Reserve declares a plan for tapering in Q1 or early Q2 2014, it will be also met with a renewed commitment of a 0-0.25% federal funds rate until 2017. I believe this type of renewed commitment could ultimately quell the fears of sharply rising rates, since a low federal funds rate essentially puts a cap on how high the yield curve can steepen.
I currently have an agnostic viewpoint with regards to interest rates, but this could ultimately change with improvements in the labor markets, U.S. budget deficit, or GDP growth. As the percentage of Fed Treasury and MBS purchases vs new issuance has increased rapidly over the last several months, it’s only a matter of time before Fed Chairman Yellen is forced into action.
Even with the rise in the 10 Year Treasury Note yield (and interest rates in general) this year, corporations have been issuing debt at a historic rate. According to Bloomberg, U.S. corporate bond sales surpassed $1.48 trillion this year which is a new annual record. That speaks to the thirst for yield from income hungry investors as well as companies taking advantage of the opportunity to lock in historically low debt service levels.
So where do we go from here and how should you position your portfolio?
As a trend follower, I have been advocating selling long duration securities in favor of shorter duration holdings with a risk management mindset. Right now I am focusing my fixed-income exposure into ETFs and mutual funds that have an overweight allocation to high yield, bank loans, convertibles, and other performing sectors.
If the 10 Year Treasury Note yield breaks above 3.0%, it could very well head to 3.5% in a hurry. That would likely lead to another wave of outflows from aggregate bond funds and additional fear in the marketplace.
However, I think that we are eventually going to see another round of deflationary rotation at some point in 2014 that will be bullish for bonds. That is why I am sticking with my core holdings and continuing to look for value opportunities where they may present themselves. We will likely need to transition from credit sensitive to interest rate sensitive holdings at some point in order to adjust to a deflationary environment.
The key to successfully navigating the interest rate environment next year will be to stay vigilant and proactive. Keeping a balanced mindset and staying ahead of the curve will allow you to preserve your capital and profit when opportunities present themselves.
Twitter: @fabiancapital
No position in any of the mentioned securities at the time of publication. Any opinions expressed herein are solely those of the author, and do not in any way represent the views or opinions of any other person or entity.


: Showing Some Signs of Emerging Strength")
