S&P 500 Index Trading Outlook (3-5 Days): Bearish
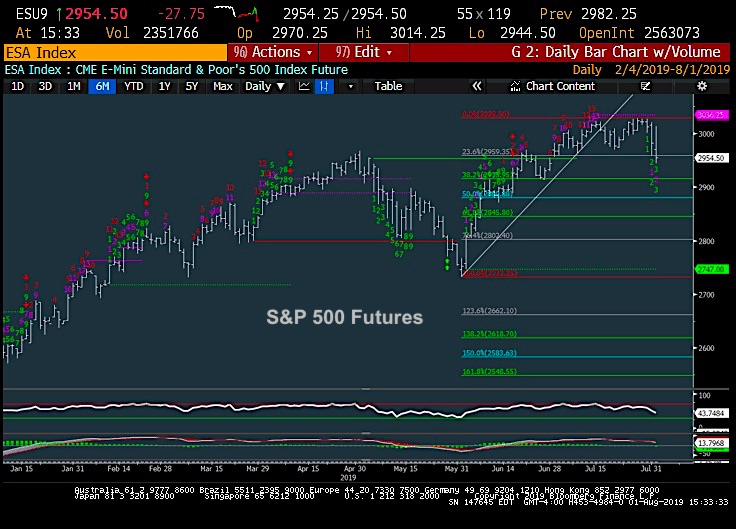
Early gains faded and violated 2954 into the close yesterday on the S&P 500 Index INDEXSP: .INX. This is a bearish signal, as 2954 support stretches back to early July.
Structurally this is the first real sign of technical damage to the stock market.
I am expecting a further stock market decline that tests 2915-7 before a bounce. In sum, it pays to be defensive until 3014 can be recaptured (which is a long way higher given Thursday’s stock market reversal).
For now, patterns have grown worse and prior highs from late April have been undercut. While positive momentum divergence is in place on hourly charts, warning of a possible bounce in the near future, this has been a fairly damaging break, and could get down to 2915-7 before much support.
Looking back, the following 10 reasons seemed important and negative:
1) Sideways action since mid-July which had a negative effect on short-term momentum
2) A drying up in volume (This past Monday witnessed the 2nd lowest volume in SPY all year)
3) Market breadth broke down in mid-July before rallying back, but now looks to be rolling over again
4) Daily momentum oscillators like MACD rolled over to negative more than a week ago (most of this was due to the sideways action, but still a negative)
5) Emerging markets had seen pronounced weakness starting back in July, never following suit to the strength in USA and Europe (USD related)
6) Semiconductors had shown weakness starting around 7/24, nearly a full week ahead of the selling (This leading sector typically is always worth keeping an eye on)
7) Transportation stocks have been lagging badly lately, and despite some minor attempt to play catch-up, DJ Transportation Avg still lies below April and below last Sept highs
8) Small-cap and Mid-cap averages have both plummeted to 10 year lows vs the broader S&P, showing pronounced weakness in every area except Large-cap Growth
9) Counter-trend Demark indicators like TD Sequential and TD Combo lined up to show a confluence of upside exhaustion on both daily and weekly charts
10) Defensive strength- In the month of July, markets showed stronger performance within the Staples group than Discretionary.
Going forward, it’s going to be crucial for prices to rebound nearly right away to think this was just a minor blip.
My time frame for a trend change has focused on the early part of August, and given the last couple days of selling, it sure looks like we’ve arrived.
To have any inkling that this is a false move, we’ll need to see heavy volume and breadth on the upside, and make up some substantial ground to negate some of this near-term technical damage. (S&P would require a move back up above 3014)
For now, I’m inclined to trust this selling, given the warnings, though feel that true damage might only prove to be 5-8% in nature given the anxious state of sentiment in its current form. Given the lack of any Trade deal and ongoing policy uncertainty, there seems to be a higher level of pessimism than ordinarily would be warranted with indices near all-time highs. Thus, a decline would serve to bring out skepticism and real fear much quicker than normally (which in turn, likely could make the selloff short-lived)
If you have an interest in seeing timely intra-day market updates on my private twitter feed, please follow @NewtonAdvisors. Also, feel free to send me an email at info@newtonadvisor.com regarding how my Technical work can add alpha to your portfolio management process.
Twitter: @MarkNewtonCMT
Author has positions in mentioned securities at the time of publication. Any opinions expressed herein are solely those of the author, and do not in any way represent the views or opinions of any other person or entity.


