The following research was contributed by Christine Short, VP of Research at Wall Street Horizon.
During the Q2 earnings season we profiled 10 companies that had unusual or revised earnings dates which can serve as a foreshadowing of what an upcoming report might reveal, and therefore be an indicator of financial health.
Seventy-percent of those companies’ stocks reacted as we expected, using the Wall Street Horizon DateBreaks Factor logic.¹ Below we review all 10 of those names and how they performed in the three days following their announcement.
Conagra Brands (CAG) – Expected Logic
Company Confirmed Report Date: Tuesday, July 13, BMO
Projected Report Date (based on historical data): June 30, BMO
Z-Score: 7.54
DateBreaks Factor: -3¹
We flagged Conagra ahead of their Fiscal Q4 (Calendar Q2) report because they confirmed an unusual earnings date, outside of the historical date range in which we’ve typically seen them report. CAG tends to release CQ2 results between June 21 – 30, and have done so since 2006. However, this year they confirmed they would be announcing 2 weeks later on July 13. According to academic research, a later than usual earnings date often indicates bad news will be announced.
Results:
Despite beating EPS (actual: $0.54, est: $0.52) and revenue expectations (actual: $2.740B, est: $2.712B), Conagra trimmed their guidance for FY 2022.² While they expect demand to remain high for their products, inflation is impacting their bottom-line. They now expect organic net sales to be flat YoY and EPS of $2.50, vs. previous guidance of $2.63 – $2.73. Of course we know investors care more about forward looking guidance than past performance, and as expected the stock started to drift lower. This resulted in a price decrease of $2.14 or -5.9%.³
Thursday, July 8 – $36.09
Friday, July 9 – $36.12
Monday, July 12 – $35.93
Tuesday, July 13 – $33.98 – Reported BMO
Wednesday, July 14 – $34.68
Thursday, July 15 – $34.86
Rexnord Corp (RXN) – Expected Logic
Company Confirmed Report Date: Tuesday, July 20, AMC
Projected Report Date (based on historical data): August 3, AMC
Z-Score: -5.59
DateBreaks Factor: 3¹
Rexnord Corp crossed our rader ahead of their FQ1 2022 report with a confirmed earnings date that was outside of their historical range. RXN has reported CQ2 results between July 28 – August 6 for the last 7 years. However, this quarter they confirmed they would be announcing 2 weeks earlier than our projected date of August 3. The drastic advancement of the earnings date indicated a positive report ahead.
Results:
Rexnord reported Q2 results that surpassed expectations on both the top (actual: $568.30M, est: $543.50M) and bottom-line (actual: $0.58, est: $0.50).² This resulted in a price rise of $4.44 or +9.2%.³
Friday, July 16 – $49.76
Monday, July 19 – $48.54
Tuesday, July 20 – $50.40 – Reported AMC
Wednesday, July 21 – $52.98
Thursday, July 22 – $52.74
Friday, July 23 – $52.78
Marsh & McLennan (MMC) – Expected Logic
Company Confirmed Report Date: Tuesday, July 22, BMO
Projected Report Date (based on historical data): July 29, BMO
Z-Score: -3.47
DateBreaks Factor: 3¹
Marsh & McLennan also had a report date that was earlier than their historical average. MMC typically reports Q2 results between July 26 – August 7, and has done so since 2006. On June 24 the company issued a press release stating that Q2 results would be released on July 22, a week earlier than we had estimated. As such we anticipated better-than-expected results on earnings day.
Results:
Marsh & McLennan easily surpassed Wall Street estimates for both EPS (actual: $1.75, est: $1.43), and revenues (actual: $5.017B, est: $4.515B).² Satisfied investors took the stock up $8.60 or +6.2% in the 3-day post-earnings period.³
Monday, July 19 – $139.04
Tuesday, July 20 – $141.70
Wednesday, July 21 – $142.39
Thursday, July 22 – $145.90 – Reported BMO
Friday, July 23 – $147.41
Monday, July 26 – $147.64
Microsoft (MSFT) – Expected Logic
Company Confirmed Report Date: Tuesday, July 27, AMC
Projected Report Date (based on historical data): July 21, AMC
Z-Score: 3.97
DateBreaks Factor: -3¹
We don’t often see mega-cap companies reporting outside of their historical earnings date range, which is why all the alarms went off when we noticed Microsoft had confirmed they were reporting a week later than usual. MSFT typically releases their FQ4 results between July 17 – 23, and have done so since 2007. Microsoft usually pre-announces two weeks before its earnings date, so we had clues that they were reporting late. Indeed on July 13, the company announced it would post results on the afternoon of July 27—a week later than first estimated.
Results:
Despite putting up stellar results for the second quarter, beating on EPS (actual: $2.17, est: $1.92), and revenues (actual: $46.152B, est: $44.221B), a slowing top-line growth forecast and issues with chip shortages were not well received by traders.² This resulted in a price drop of $4.76 or -1.6%.³
Friday, July 23 – $289.67
Monday, July 26 – $289.05
Tuesday, July 27 – $286.54 – Reported AMC
Wednesday, July 28 – $286.22
Thursday, July 29 – $286.50
Friday, July 30 – $284.91
Vista Outdoor (VSTO) – Expected Logic
Company Confirmed Report Date: Thursday, July 29, AMC
Projected Report Date (based on historical data): August 5, AMC
Z-Score: -5.11
DateBreaks Factor: 3¹
We weren’t surprised to see Vista Outdoor pull their earnings date forward last quarter as leisure and recreation names have been on an impressive run. Since their IPO in 2015, VSTO has always reported FQ1 results any time from August 6 – 13, always on a Thursday. On July 8 the company issued a press release stating that FQ1 results would be released on July 29 this year.
Results:
Sure enough, the company beat the sell-side’s profit (actual: $1.74, est: $0.90) and sales expectations (actual: $662.91M, est: $613.78M).² Investors went on to reward Vista Outdoor’s stock, bringing it up $5.03 or +13% in the 3-day post earnings period.³
Tuesday, July 27 – $38.50
Wednesday, July 28 – $39.04
Thursday, July 29 – $41.22 – Reported AMC
Friday, July 30 – $40.39
Monday, August 2 – $41.29
Tuesday, August 3 – $43.53
British Petroleum (BP) – Reverse Logic
Company Confirmed Report Date: Tuesday, August 3, BMO
Previously Confirmed Date: July 27, BMO
British Petroleum is the one of two companies in this bunch that actually revised their originally confirmed earnings date. BP initially confirmed a Q2 report date of July 27, subsequently changing it to August 3, usually a sign that bad news is ahead.
Results:
When BP reported they handily beat on the bottom-line (actual: $0.83, est: $0.61) but missed expectations on the top-line (actual: $36.47B, est: $40.70B).² They also announced they were expanding their dividend and share buyback program, a boon for investors. This resulted in a price increase of $1.61 or +6.7%.³ Upon further investigation it appears BP also revised their earnings date in Q2 2020, from July 28 to August 4. This occurred just after new CFO Murray Auchincloss assumed the post, which could explain the moving dates. We often notice that changes in management affects earnings dates.
Thursday, July 29 – $24.63
Friday, July 30 – $24.18
Monday, August 2 – $24.08
Tuesday, August 3 – $25.69 – Reported BMO
Wednesday, August 4 – $25.06
Thursday, August 5 – $25.34
Goodyear Tire & Rubber Co. (GT) – Reverse Logic
Company Confirmed Report Date: Friday, August 6, BMO
Projected Report Date (based on historical data): July 30, BMO
Z-Score: 3.97
DateBreaks Factor: -3¹
We flagged Goodyear Tire & Rubber ahead of their Q2 report because they confirmed an unusual earnings date, outside of the historical date range which we’ve typically seen them report. GT usually releases Q2 results between July 26 – 31, and have done so since 2007, always on a Friday. In 2005 and 2006, however, they did report on August 4. This year they announced plans to release results on August 6, a week later than their 14-year trend.
Results:
Goodyear Tire reported EPS that was double analyst expectations (actual: $0.32, est: $0.16), and easily beat revenue estimates as well (actual: $3.988B, est: $3.735B).² This resulted in a price increase of $1.93 or +12.9%.³
Tuesday, August 3 – $15.71
Wednesday, August 4 – $14.97
Thursday, August 5 – $15.26
Friday, August 6 – $16.26 – Reported BMO
Monday, August 9 – $16.36
Tuesday, August 10 – $16.90
Air Products & Chemicals Inc. (APD) – Expected Logic
Company Confirmed Report Date: Monday, August 9, BMO
Projected Report Date (based on historical data): July 29, BMO
Z-Score: 3.81
DateBreaks Factor: -3¹
Air Products and Chemicals got our attention when they confirmed a FQ3 earnings date that was two weeks outside of their historical range. APD has reported CQ2 results between July 22 – August 1 for the last 15 years. However, this quarter they confirmed they would be announcing 2 weeks later than our projected date of July 29. This would also be the first time they reported on a Monday, another unusual move.
Results:
When Air Products & Chemicals reported, they missed on EPS (actual: $2.31, est: $2.36) and beat on revenues (actual: $2.605B, est: $2.498B).² This resulted in a price drop of $15.07 or -5.2%.³
Wednesday, August 4 – $287.67
Thursday, August 5 – $288.72
Friday, August 6 – $290.82
Monday, August 9 – $275.75 – Reported BMO
Tuesday, August 10 – $277.87
Wednesday, August 11 – $278.73
eBay Inc. (EBAY) – Reverse Logic
Company Confirmed Report Date: Wednesday, August 11, AMC
Projected Report Date (based on historical data): July 27, AMC
Z-Score: 4.64
DateBreaks Factor: -3¹
This is eBay’s second consecutive Q2 reporting drastically outside of their historical range. In Q2 2020 the company shifted reporting from the third week of July into the last week of the month, likely attributable to COVID-19 lockdowns and the ensuing uncertainty. This year we estimated EBAY would announce on July 27. They later confirmed an unusually late date of August 11, the first time they have reported Q2 results in August since we started tracking this name in 2006. Typically we would assume this meant bad news would be shared in the upcoming announcement. However, we were aware that another possible reason for this could be due to recent management changes. In May, eBay issued a press release stating it would bring on a new CFO. Scott Priest, formerly CFO of Jetblue, officially took his new post on June 21.
Results:
eBay reported on August 11 and beat Wall Street’s EPS (actual: $0.99, est: $0.96) and revenue estimates (actual: $2.668B, est: $2.626B).² This resulted in a price increase of $9.90 or +15.1%.³
Monday, August 9 – $65.35
Tuesday, August 10 – $67.31
Wednesday, August 11 – $68.02 – Reported AMC
Thursday, August 12 – $68.89
Friday, August 13 – $74.02
Monday, August 16 – $75.25
Ulta Beauty (ULTA) – Expected Logic
Company Confirmed Report Date: Wednesday, August 25, AMC
Previously Confirmed Date: August 26, AMC
Like BP, Ulta also revised their earnings date for the second quarter. ULTA initially confirmed their earnings date for Thursday, August 26, later changing it to a day earlier, Wednesday August 25. This didn’t trigger a significant Z-score on our end, but nonetheless piqued our interest as it’s somewhat uncommon for high profile companies to change their earnings date once confirmed. Regardless, we took the earlier date as a good sign that Ulta was preparing to share good news with inventors.
Results:
When Ulta Beauty reported, they blew past EPS (actual: $4.52, est: $2.57) and revenue expectations (actual: $1.967B, est: $1.765B), posting YoY growth of 519% and 60%, respectively.²³ Same Store Sales came in at 56.3% for the quarter. This resulted in a price increase of 18.68 or +5%. Despite clear signs that make-up sales are recovering, early gains tapered off after Wells Fargo downgraded ULTA to equal weight, commenting that it was “difficult to envision upside” given the high price at which the stock currently trades.
Monday, August 23: $370
Tuesday, August 24: $373.85
Wednesday, August 25: $389.90 – Reported AMC
Thursday, August 26: $388.68
Friday, August 27: $387.23
Monday, August 30: $383.17
For more information on the data sourced in this report, please email: info@wallstreethorizon.com
Wall Street Horizon provides institutional traders and investors with the most accurate and comprehensive forward-looking event data. Covering 9,000 companies worldwide, we offer more than 40 corporate event types via a range of delivery options from machine-readable files to API solutions to streaming feeds. By keeping clients apprised of critical market-moving events and event revisions, our data empowers financial professionals to take advantage of or avoid the ensuing volatility.
Sources:
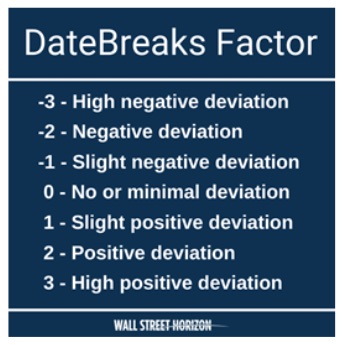
¹ The DateBreaks Factor is a Wall Street Horizon proprietary measure, using a modified z-score protocol which looks at standard deviations from the norm and that captures the extent to which a confirmed earnings date deviates or breaks from historical trend (last 5 years) for the same quarter.
Negative means the earnings date is confirmed to be later than historical average while Positive is earlier.
² EPS and Revenue estimates provided by FactSet
³ Price change based on the highest or lowest point the stock reaches within the 3 days before and after reporting quarterly earnings results. Delta calculated from closing price.

Christine Short, VP of Research at Wall Street Horizon, is focused on publishing research on Wall Street Horizon event data covering 9,000 global equities in the marketplace. Over the past 15 years in the financial data industry, her research has been widely featured in financial news outlets including regular appearances on networks such as CNBC and Fox to talk corporate earnings and the economy.

 Flirting With Critical Support… Again")

