Folks, I’ve been covering the markets for a long time. I don’t simply share ideas on the market, I share what I am seeing in chart patterns. Some work, some don’t. But they help us define our risk and understand when major opportunities may be knocking. Case in point: Twitter stock (TWTR).
Keep in mind, that as a pattern recognition guy, all that matters is price. I don’t have any reason to blur my opinion or any fundamental reasoning on the market and stocks.
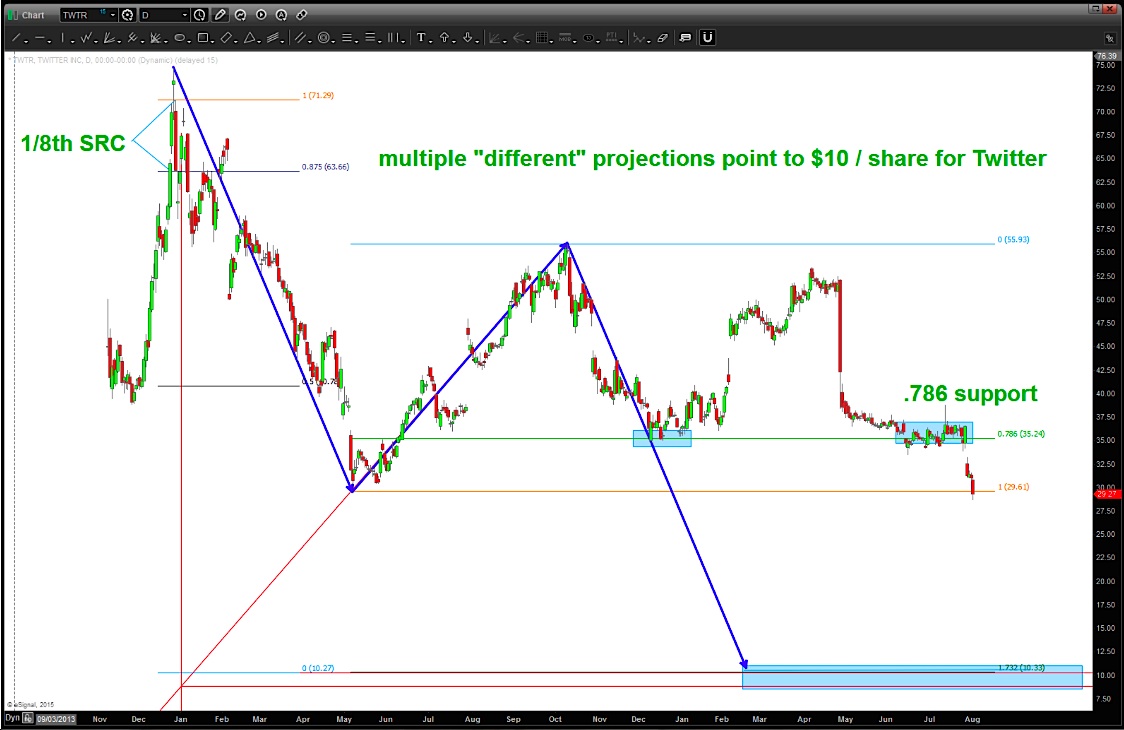
Last August, I shared a chart of Twitter stock price that showed why it could head as low as $10 per share. In fact, the title of the post was: “$TWTR Pointing To $10/Share“. It looked destined for lower prices.
Simply put, the math pointed to $10 per share for Twitter stock, not some crystal ball or anything else. Once it broke thru the .786 Fibonacci support level (math based only) it was set to extend lower… and that’s what it’s doing now as it makes new lows.
Here’s the chart from August 4:
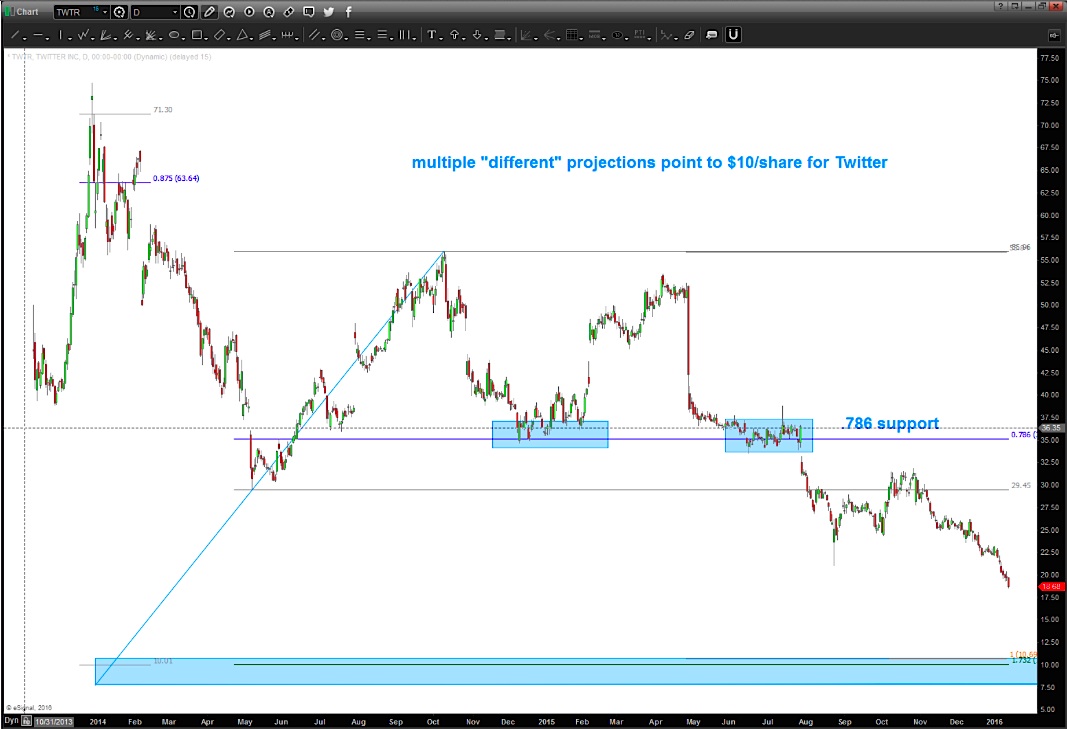
Here’s an updated Twitter stock chart from this week. It might get to 10 or perhaps even a bit lower. Or perhaps not. The math says $10 though and the patterns have worked thus far.
Thanks for reading and stay disciplined out there.
Twitter: @BartsCharts
Author does not have a position in mentioned securities at the time of publication. Any opinions expressed herein are solely those of the author, and do not in any way represent the views or opinions of any other person or entity.

 Flirting With Critical Support… Again")


