 By Andrew Nyquist
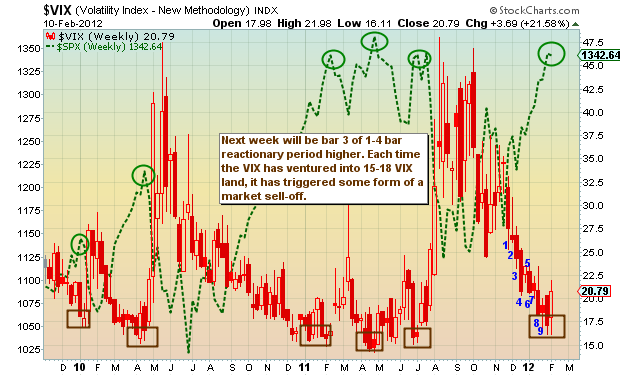
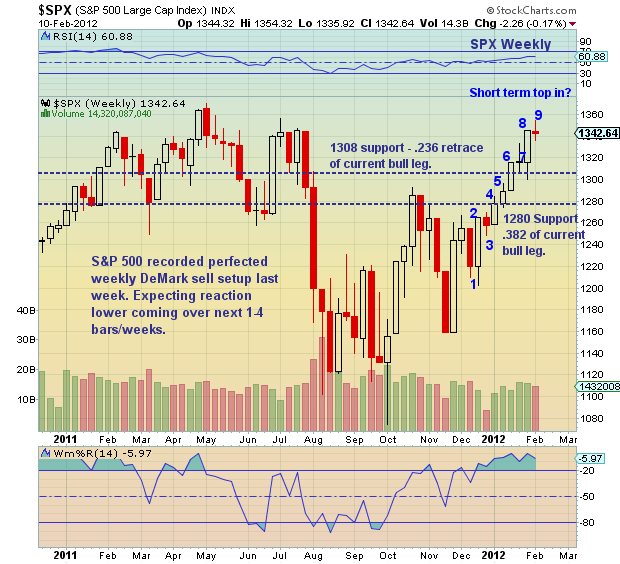
Can’t deny market strength here. But I certainly can sell into it/short it. What? Yeah, that’s right, I’ve been adding to my short index fund trade recently (most in SH, starter in SDS). But not because I’m looking for a big drop, but because I’m playing the the technical risk-adjusted odds… Over the past couple of years, when the Volatility Index (VIX) hits a 15-18, a red sell sign starts flashing on the S&P 500. And further, with a weekly DeMark buy setup in place on the VIX, and a weekly DeMark sell setup in place on the S&P 500, my brain is now operating in reverse (see charts below).
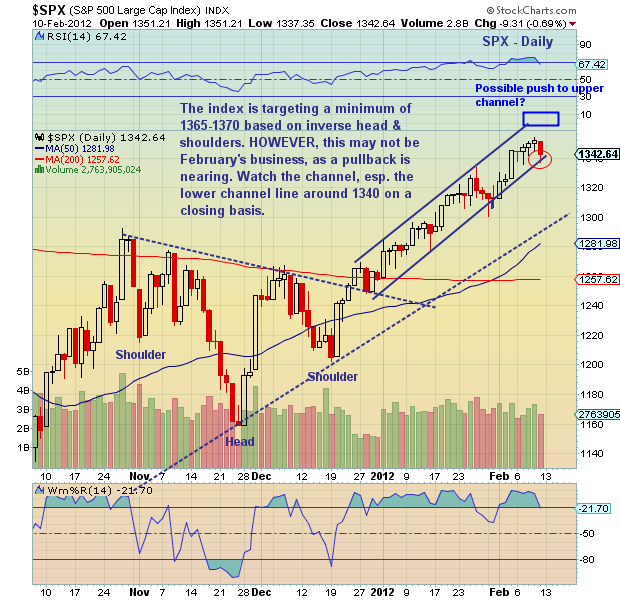
You see, I don’t need to make 10 percent on “an against the grain” trade to feel like a winner here. It’s a patient, slow motion, dollar cost average plan that I’ve been employing with the short index funds over the past couple weeks. And although I’m still actively trading, I’m trying to ensure that my brain stays on top of the market by tuning out the emotional noise and tuning in the day by day ebb and flow of the charts. I have 50 percent of my capital in this trade and would like to get another leg (or two) in, but that’s a function of what happens next week. If we race higher, I’ll be buying more short index funds. I’ll also selectively add if we breakdown and close below 1340. I see 1308 (the .236 fib retrace) and 1279 (.382 fib retrace) as near term support levels to layer out of the short index positions.
Lastly, my thoughts on the stock market in general. I’m looking for a plus 1400 print on the S&P 500 this year. Although this could come quickly (setting up a bigger selloff), I currently see a pullback to 1275ish followed by another leg higher. Note the inverse head and shoulders on the S&P 500 daily chart projects to at least 1365-1370 (at the far bottom).
So I have yet to climb aboard the doomsday approach. One of the main reasons for this is the relationship between the S&P 500 and the VIX. And further, the strength in the S&P 500 relative to the VIX. The VIX is going into week 3 of a 1-4 week upside reaction. And the initial thrust higher didn’t occur until the middle of last week… almost 2 weeks in. I attribute the delay in the VIX reaction to market strength. Meanwhile, the S&P 500 continued to power higher, needing time to fulfill near term price exhaustion objectives… recording a weekly 9 sell setup last week.
Note as well that each initial touch down into 15-18 pricing zone on the VIX produced a selloff that was bought by the market. And the market didn’t top until 2-3 months later. History doesn’t always repeat, but often rhymes. Just something to keep in mind.
But for my near term trading objectives, I’m focused on the point that the 15-18 VIX area produces a market selloff. Happy investing.
Additional recommended reading: The Anatomy of a Trader, Part 3: Vision Quest and Technical Analysis 101: Defining Support and Resistance
———————————————————
Your comments and emails are welcome. Readers can contact me directly at andrew@seeitmarket.com or follow me on Twitter on @andrewnyquist or @seeitmarket. For current news and updates, be sure to “Like” See It Market on Facebook. Thank you.
Position in S&P 500 related short index funds SH & SDS.
Any opinions expressed herein are solely those of the author, and do not in any way represent the views or opinions of his employer or any other person or entity.


