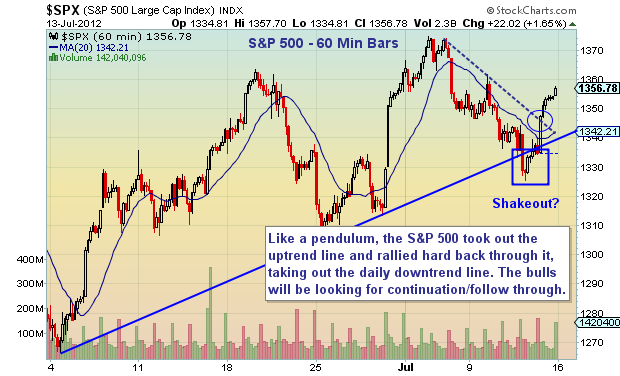
 Last week, I mentioned that the uptrend line may be a likely target for the S&P 500 as it heads lower, stating that it was a “confluence of support: lateral, uptrend, and 50 dma.”
Although this area was broken intraday, it was not “sustained” and there wasn’t any follow through to the downside. To the contrary, the follow through came after the trap door shut, and it was to the upside. In technical terms, this is what we call a “shakeout.”
Often times, this sort of action is epitomized by traders selling into fear, then buying back higher as they “miss” the move. And furthermore, this is why it is so important to work hard each day to eliminate emotion from trading. The market has been choppy of late, with big swings in both directions. Try this on for size: Since the June 4 bottom, the S&P 500 has experienced swings from 1266 to 1363, back down to 1310 (in 4 days), back up to 1374 (in 6 days), back down to 1325, and now up again… choppy waters my friends. Be sure to stay disciplined and size positions accordingly.
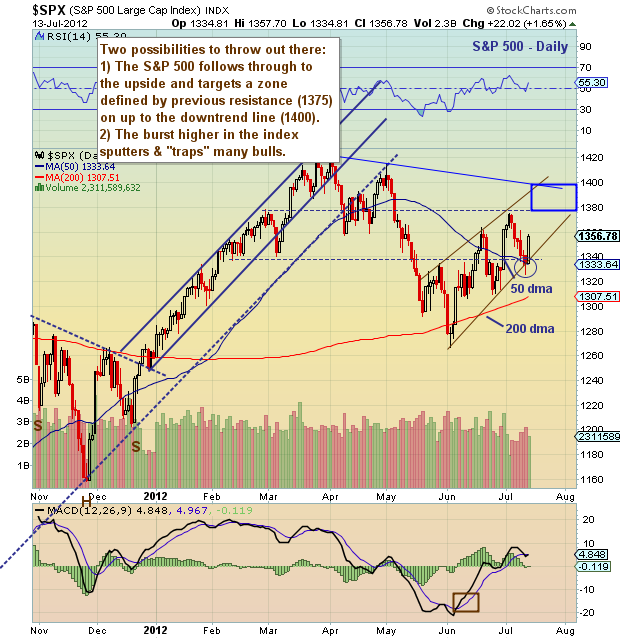
On the downside, keep watching that uptrend line. A sustained break lower with follow through would be risk off. But until that occurs, the ball is in the bulls court. Two targets to the upside include 1375 resistance and the macro downtrend line at 1400 (and descending). Trade safe and have a great weekend.
60 minute Bar Chart:
Daily Bar Chart:
Twitter: @andrewnyquist and @seeitmarket Facebook: See It Market
No position in any of the securities mentioned at the time of publication.
Any opinions expressed herein are solely those of the author, and do not in any way represent the views or opinions of his employer or any other person or entity.


