The rally in Corn and soybeans prices continued this week due to follow through speculation on the potential for lost soybean acreage and deteriorating crop conditions primarily in the ECB. The culprit continues to be unwanted and excessive precipitation.
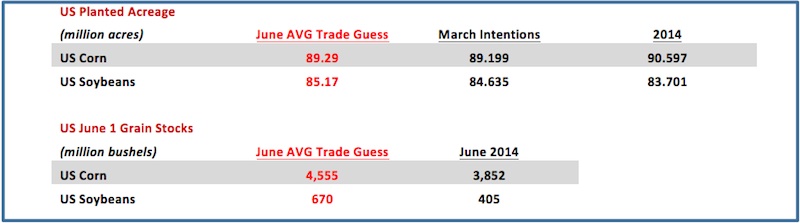
The average trade guesses for next Tuesday’s June 30th Acreage and Stocks report are as follows:
Monday’s Crop Progress report showed the US corn good-to-excellent rating falling 2% versus last week to 71% compared to 74% a year ago. Indiana and Ohio’s good-to-excellent ratings in particular go hit the hardest with Indiana’s down 15% week-on-week and Ohio down 19%. Also noted was Illinois’s corn rating decreasing 6%. Those three states accounted for 28.5% of total US corn production in 2014. The US soybean good-to-excellent rating was also off 2% versus a week ago coming in at 65% compared to 72% in 2014. Missouri’s soybean crop was still just 51% planted versus 88% on average.
Given the incredibly wet spring and now early summer in sections of Kansas, Missouri, Indiana, Illinois, and Ohio it remains extremely difficult trying to measure just how many acres did or did not get planted. The trade also seems confused as to the long-term impact of “too much rain” on yield potential.
Given those uncertainties, the immediate reaction has thus far been for money managers to continue squaring a percentage of their net short positions in both corn and soybeans in an attempt to reduce their price exposure prior to Tuesday’s June Acreage and Stocks report. From May 26th through June 23rd, the Commitment of Traders report showed the managed money net short in soybeans decreasing from a -103,963 contracts to a net LONG of 1,829 contracts. Over that same time period the managed money net short in corn decreased from -140,443 contracts to -94,522 contracts. Given the nearly 40-cent rally this week in December corn futures and over 60-cent rally in November soybeans, it’s apparent more and more “money” is moving to the sidelines.
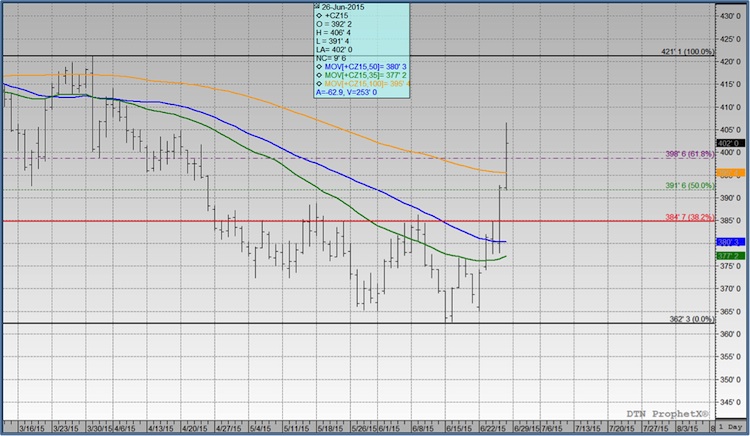
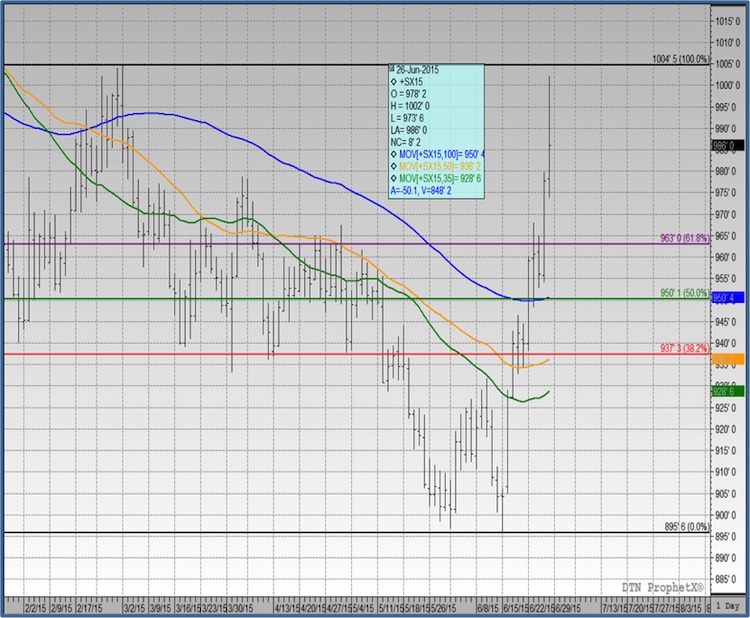
There were some significant resistance levels penetrated this week. December corn traded through and closed above the 100-day moving average at $3.95½. CZ5 traded up to its highest level since April 8th, 2015. This triggered additional buy-stops. The next upside target would likely be the day high on March 31st, 2015 of $4.21¼. November soybeans traded up to its highest level since March 2nd, 2015 (day high of $10.02). The 100-day moving average in November soybeans at $9.50½ should now act as support.
The question is can this rally continue or is this a selling opportunity? The average trade guesses still suggest that both corn and soybean acres will go up in the June 30th Acreage report. Furthermore, June 1 corn stocks are expected to be up more than 700 million bushels more than a year ago. Soybean stocks are expected to be up more than 260 million bushels versus 2014.
December Corn Prices (futures) Chart
November Soybeans Prices (futures) Chart
Checking In On Ethanol
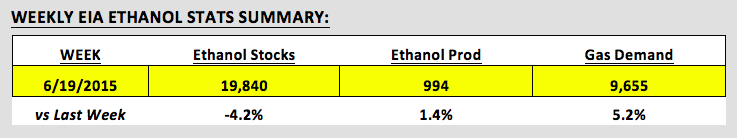
This week’s EIA report showed weekly ethanol production establishing a new record high of 994,000 bpd, eclipsing the previous mark of 992,000 bpd, which was initially set on 12/19/2014 and then matched again on 6/5/2015. The surprise however was that even with the record run-rate ethanol stocks declined week-on-week by 4.2%, falling to 19.840 million barrels. This is the lowest US ethanol inventories have been since January 2nd, 2015. The largest stocks draws occurred in PADD 1 (East Coast down 242,000 barrels) and PADD 3 (Gulf Coast down 357,000 barrels). Gasoline demand was once again very strong coming in at 9.655 MMbpd versus 8.813 MMbpd for the same week a year ago. For the first 3 weeks of June gasoline demand has averaged 9.477 MMbpd versus 8.898 MMbpd in 2014. Clearly the surge in gasoline demand has helped offset the potential for significant ethanol inventory builds due to an ethanol run-rate that has averaged a remarkable 987,000 bpd over that same 3-week time period.
Thanks for reading and have a great weekend.
Data References:
- USDA United States Department of Ag
- EIA Energy Information Association
- NASS National Agricultural Statistics Service
Any opinions expressed herein are solely those of the author, and do not in any way represent the views or opinions of any other person or entity.


")


")