Each morning, active investors prepare for the day ahead by eyeing futures, screening stocks, checking out their favorite websites, and monitoring their twitter streams.
But throughout the morning routine and trading session, most traders are actually focused on something more important… something many are often subconsciously unaware of: their daily confrontation with arguably the two most important aspects of investing: time and price analysis.
And the sooner traders and investors learn to embrace and respect the harmony of time and price, the better their investment choices and performance will be.
Getting time and price right or wrong can be the difference between a single and a homerun. Or put in simple terms, a gain or a loss… or a large loss, if undisciplined. And therein lies the key to understanding time and price: discipline.
If you want to day trade or swing trade a stock on technical analysis, don’t become a long-term fundamental investor as the trade gets away from you. In fact, don’t let the trade get away from you. You already set your time frame, so now you need to set your price targets and stop losses. Time and price. Stop losses save us when we don’t get the price right within our given time frame.
On the same hand, we also have to realize that two investors can play the same security in opposite directions under different time frames. And this is important to understand when reading through your Twitter feed or latest analysis on a given security.
This is also good for social traders to note: when sharing stock picks/trades try to be clear about your time horizon. It doesn’t need to be as precise as 2 hours or two days, simply stating very short term or short term helps. In the end, we are all accountable for our own actions, but differentiating between short and longer term time frames helps. Visual aides (i.e. charts or tables) are appreciated and helpful as well. Also read Jeff Wilson’s post on time frames.
So, just for practice, let’s look at a few examples of time and price opportunity analysis, taking into account different risk profiles as well. Note that these examples are simple in nature and are solely meant for the purpose of demonstrating two points: 1) That “time” not only matters on your long or short entries, but also on your time frame for exiting and 2) That different time frames dictate how an investor or trader determines price point opportunity.
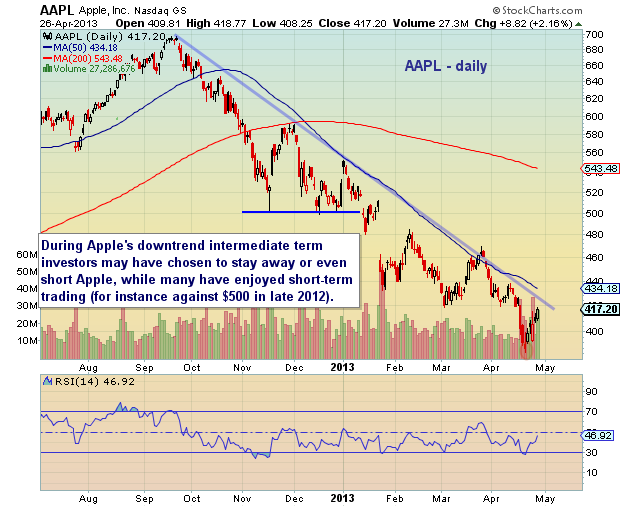
Apple (AAPL) is a stock that has been “over” traded by many. Whether a 15 minute or 2 week time frame, many have found success trading Apple. This is in contrast to intermediate to longer-term trend investors that may choose to stay away, or simply short.
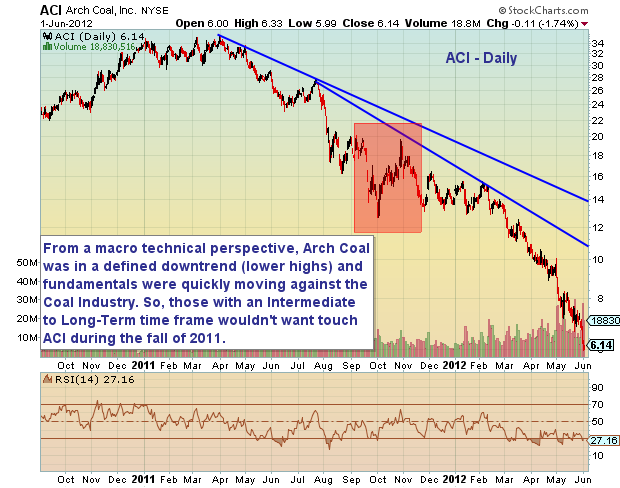
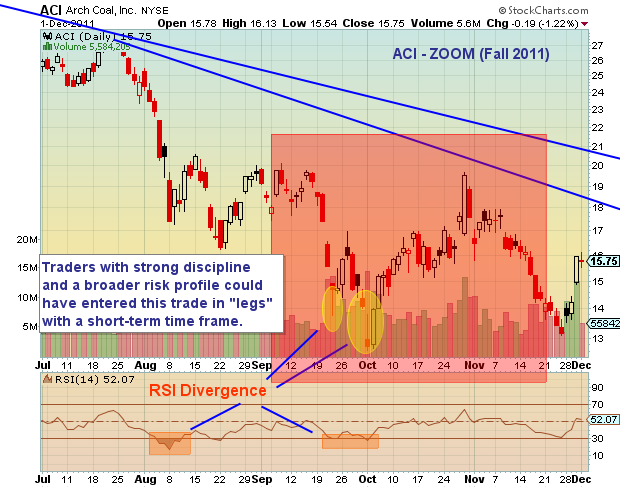
Arch Coal (ACI) offers a more extreme case of time and price opportunity analysis. This example is similar to AAPL but with higher volatility and a deeper drop. More specifically, looking at the fall of 2011, ACI formed an RSI divergence that may have been compelling for shorter-term traders with a broad risk profile. However, when considering the macro downtrend and deteriorating fundamentals, quality longer-term trend investors wouldn’t be interested.
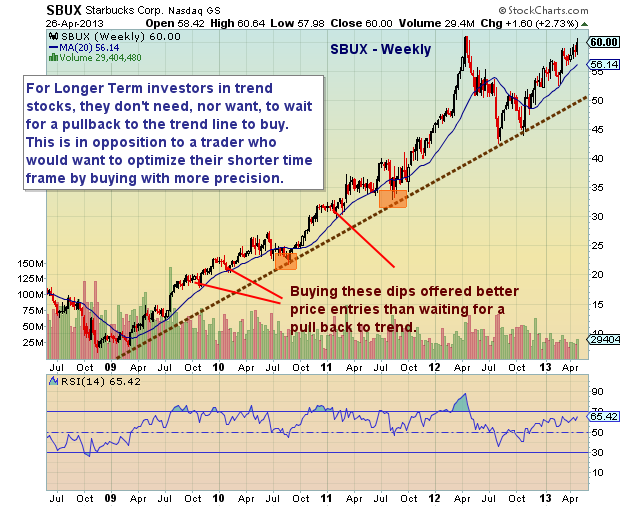
A final example of differing time and price analysis can be found with Starbucks (SBUX) recent uptrend. Where short-term traders may look to go long (or even short at certain points), a longer-term trend trader would simply “buy the dip” indiscriminately.
Twitter: @andrewnyquist and @seeitmarket
No position in any of the mentioned securities at the time of publication.

: Showing Some Signs of Emerging Strength")
