The U.S. Dollar Index has been trading in a wide consolidation pattern over the last 18 months or so. But after the recent U.S. Dollar rally, that consolidation has formed two distinct chart patterns.
And as you may have guessed… one is bullish while the other is bearish.
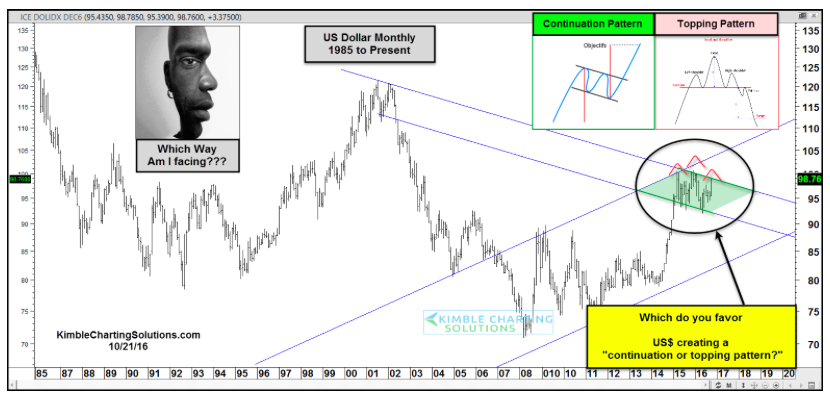
As you can see in the chart below, the recent Dollar rally has kept bulls in the game. The now 18 months long consolidation appears to be a “flag” continuation pattern. BUT, that would only be confirmed with a breakout over the upper resistance line, followed by new highs.
But there’s two ways to look at this pattern. The second (and bearish) chart pattern is a head and shoulders topping pattern In this event, bears would want resistance to hold and for the Dollar to move lower (and through lower trend line support.
The implications here are huge. A breakout higher would likely affect commodities (see my article on Crude Oil’s breakout attempt), while disturbing equities markets as well. On the flip side, should the U.S. Dollar rally stall here, bears would be given new life. And a lower Dollar would act as a tailwind to commodities and perhaps other risk assets.
Stay tuned and thanks for reading.
Twitter: @KimbleCharting
The author may have positions in related securities at the time of publication. Any opinions expressed herein are solely those of the author, and do not in any way represent the views or opinions of any other person or entity.

: Showing Some Signs of Emerging Strength")
