This week I felt it necessary to reexamine the Bullish arguments for both corn and soybeans with the market transitioning into the critical month of May for U.S. spring planting progress.
Over the last 4-weeks both corn and soybean futures have been the beneficiaries of a largely unexpected yet incredibly resilient rally. First impressions suggested this sharp move higher was essentially all money driven with the Managed Money positions in both commodities revealing a large shift in investor sentiment back to the long side of the market. However over the last week, there have been some legitimate, fundamentally supported defenses offered to substantiate the rallies in corn and soybeans outside of solely money flow.
Breaking Down The Bullish Point Of View
I felt this week they were worthy of consideration. Those defenses are as follows:
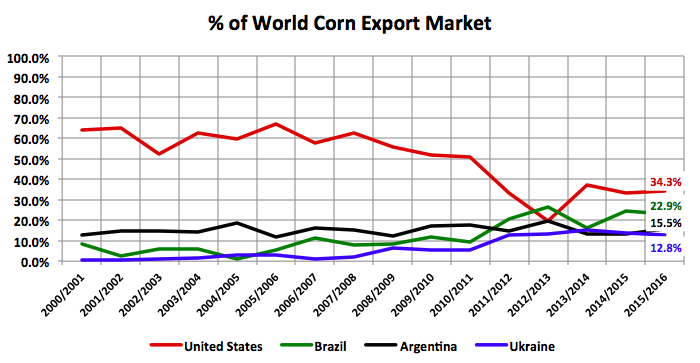
1). Crop losses in Brazil (corn via drought) and Argentina (soybeans via flooding) are proving to be both real and material, as far as, their size and potential market consequences are concerned. Last week I commented that Brazil’s corn production estimates for 2015/16 were still largely not drifting much below 82 MMT from a host of reputable private analysts versus the USDA’s April forecast of 84 MMT. Since then however the private opinion has turned even more negative with crop estimates now in the 79 MMT range, 5 MMT or approximately 197 million bushels below the USDA’s April projection.
That said what really received my attention was Thursday’s USDA Export Sales report, which showed U.S. corn export sales achieving a marketing year high 85.1 million bushels for the week ending 4/21/2016 (up 80% from the previous week). To me this was the first legitimate indication that world corn importers were starting to get nervous about their ability to source corn from Brazil, the world’s number 2 corn exporter (accounting for approximately 23% of all world corn exports). Furthermore, this week’s impressive U.S. corn sales figure reduced the marketing year-on-year export deficit to just 8% versus 2014/15. This then suggesting 2015/16 U.S. corn exports of 1,715 million bushels versus the USDA’s April forecast of 1,650 million. Therefore I’m now leaning heavily toward a 50 million bushel increase to U.S. corn export demand in the May 2016 WASDE report, which will be released on May 10th.
 A
A
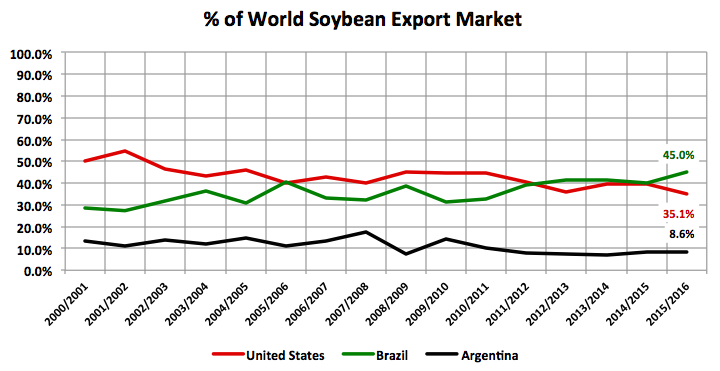
Regarding Argentina, whereas drought has been the concern with Brazil’s safrinha corn crop, excessive flooding has been the issue in northern and eastern Argentina (Entre Rios, Santa Fe, and Chaco). Consistent, heavy rains have resulted in farmland being underwater for extensive periods of time. This has forced many private analysts to lower their 2015/16 Argentine soybean production forecasts by as much as 3 to 4 MMT versus a month ago. Most recently the Buenos Aires Grain Exchange lowered its production estimate to 56 MMT with Argentina’s Ministry of Agriculture decreasing its projection to 57.6 MMT. In early April, the USDA actually raised Argentina’s soybean crop 0.5 MMT to 59 MMT.
That said the market now seems resigned to the idea that the USDA will indeed change course in May and lower Argentina’s soybean crop by as much as 1.0 to 2.0 MMT.
What role does Argentina play in the world soybean market? Argentina is world’s 3rd largest soybean producer and exporter, trailing only the United States and Brazil. Therefore the country plays a vital role in the global soybean export trade. In this week’s USDA Export Sales report, U.S. soybean exports totaled 8.3 million bushels bringing year-to-date sales up to 1,670.7 million versus 1,802.1 million a year ago. And although that sales figure actually represented a 45% decrease from the previous week and was 36% below the prior 4-week average, most traders still seem to believe 2015/16 U.S. soybean exports will be raised in the May WASDE report. Last month the USDA estimated 2015/16 U.S soybean exports at 1,705 million bushels versus 1,843 million in 2014/15.
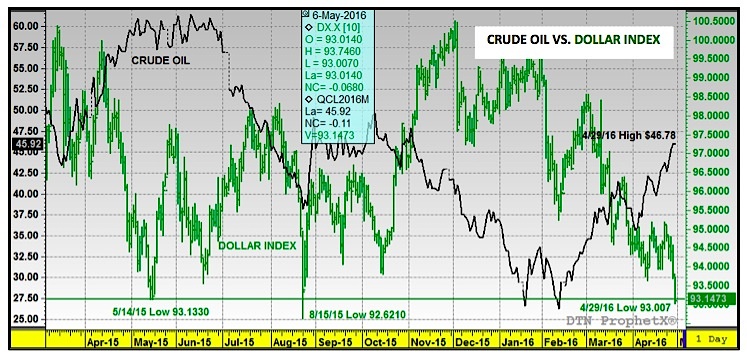
2). The other macro influence that is starting to generate more and more headlines is the continued downward spiral in the value of the U.S. Dollar. On Friday the Dollar Index slipped to its lowest level since August 15th, 2015 making a day low of 93.007. Conversely that same day June Crude Oil futures traded up to its highest level since November 4th, 2015 posting a day high of $46.78 per barrel. Also of note the RJ/CRB Commodity Total Return Index traded up to its highest level since November 24th, 2015 at 185.35. This index, which is weighted disproportionately toward energy and agricultural commodities, represents a clear picture of the money flows back into the commodity sector following sustained weakness in the U.S. Dollar. Commodities have long been used as a hedge against inflation in various trading circles with Dollar weakness also making U.S. commodities more competitive in the world export market. This combination of supportive elements has certainly been a factor in propping up both corn futures and soybean futures prices since the 1st of April. And with the Federal Reserve choosing not to raise its key interest rate last Wednesday, the Dollar Index could continue to track sideways to lower for the foreseeable future.
Corn Futures & Soybean Futures – Price Considerations:
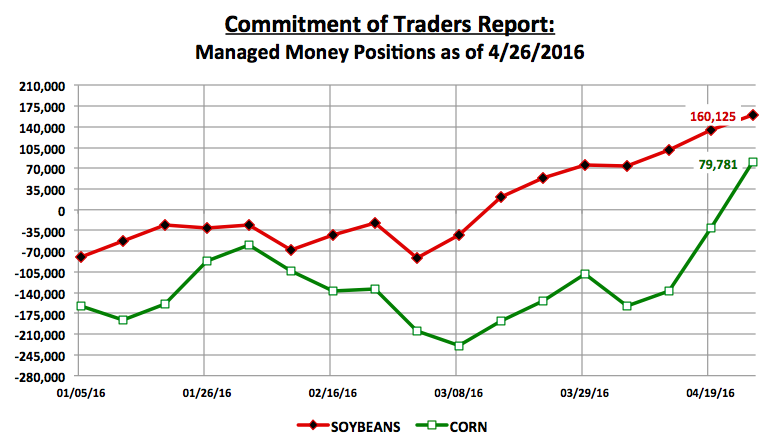
It’s become obvious over the last several weeks that regardless of the Bearish market stance, which continues to focus on more than adequate 2016 U.S. corn and soybean planted acreage intentions (93.6 million and 82.2 million acres respectively), an accelerated early corn planting pace in Iowa, Illinois, and Minnesota (3 of the top 4 largest corn producing states in the country),a good sub-soil moisture profile, large U.S. carryin stocks, and record 2015/16 World corn and soybean ending stocks, money managers have a distinctly different point of view. Friday’s updated Commitment of Traders report showed the Managed Money position in corn shifting to a net long of +79,781 contracts, representing week-on-week buying of a massive 110,689 contracts. In soybeans the Managed Money position improved to a net long of +160,125 contracts (largest net long since 4/29/14, +168,876 contracts).
I do believe the money tends to be more easily influenced by the direction in the U.S. Dollar, as well as, perceptions of an improving world export market. Does this mean the other market specific U.S. corn and soybean fundamentals are not being reflected in the current pricing trends? No… however where it’s being felt is in the cash basis of those physical commodities versus the futures market. Corn basis levels in particular have softened substantially across the Corn Belt over the last 2 weeks, which indicates both end users and commercials have all the corn they can hold at the moment.
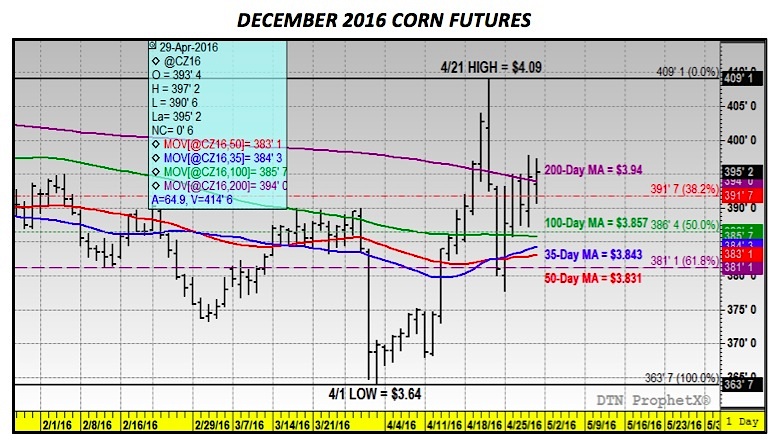
That said, can corn futures (and soybean futures) continue to rally? Absolutely; however it’s going to require a continued aggressive Managed Money buying presence. The real challenge for money managers will be the USDA’s May 10th WASDE report. That report will offer the first 2016/17 U.S. corn and soybean supply and demand tables. The corn balance sheet in particular is likely to show U.S. ending stocks in excess of 2.0 billion bushels, even if carryin stocks are down slightly from previous estimates due to a reduction in Brazil’s corn crop. That type of figure may be difficult to ignore for Corn Bulls who are considering adding to the current positions at already elevated price levels.
 SX
SX
Thanks for reading.
Twitter: @MarcusLudtke
Author hedges corn futures and may have a position at the time of publication. Any opinions expressed herein are solely those of the author, and do not in any way represent the views or opinions of any other person or entity.
Data References:
- USDA United States Department of Ag
EIA Energy Information Association
NASS National Agricultural Statistics Service


