Data from the volatility market suggests that stock market expectations in the near-term may have finally gotten a bit too complacent.
For the duration of this post-February stock rally, we have been consistent in noting the tepid, or even skeptical, sentiment readings being generated along the way. Along with strong breadth and momentum measures, this lack of belief in the stock market rally has actually been one factor that has enabled its persistence. About 6 weeks in now, however, we are finally getting some preliminary signs of complacency toward the rally on the part of traders.
One such example comes from the volatility market where expectations for near-term volatility have dropped to a historically low level. Most market observers have heard of the VIX, or the S&P 500 Volatility Index. They may not know that the VIX specifically measures the options market’s expectation for S&P 500 volatility over the next month. Another measure, the VXV, indicates volatility expectations over the next 3 months.
Understandably, the VIX normally trades below the VXV as volatility expectations should be lower for a 1-month period than for a 3-month period. However, at rare times, the VIX will trade higher than the VXV. This typically occurs in the volatility market during times of heightened anxiety in the stock market, i.e., during a decline. Very often, when the VIX has climbed above the VXV (i.e., the ratio of VIX/VXV is greater than 100%), it is an indication that traders are paying up too much on near-term volatility and the stock market is liable to put in a near-term bottom in short order.
Conversely, when the VIX drops to a very low level relative to the VXV, it can be a sign of complacency in the market. While the VXV has only been around since 2007, a possible complacency “trigger” level that has emerged is roughly the 80% mark. That is, when the VIX has dropped to below 80% of the VXV, the stock market has been susceptible to near-term weakness. Over the past 2 days, the ratio has dropped to 78%.
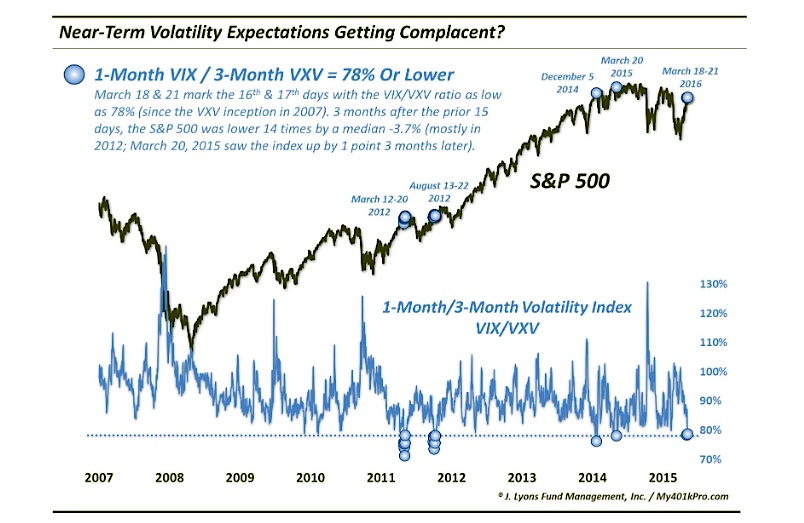
As mentioned, the VXV has been around only since 2007. Over that time, the VIX/VXV ratio has dropped to 78% on 4 prior distinct occasions:
- March 12-20, 2012 – The S&P 500 chopped sideways for a few weeks before falling some 9% over the next 2 months
- August 13-22, 2012 – The S&P 500 chopped sideways for a few weeks before rallying by as much as some 4% over the next few weeks. 2 months later, the index had lost that entire gain, and another 4%.
- December 5, 2014 – The S&P 500 immediately dropped 5% over the next 2 weeks before chopping sideways for several months.
- March 20, 2015 – The S&P 500 dropped 2.5% over the next week before moving sideways for several months.
Now there is no guarantee that stocks are about to hit an air pocket. However, given the (albeit limited) precedents, the track record in the short to intermediate-term following such readings has not been a positive one. In fact, following the prior 15 days with VIX/VXV readings below 79%, the S&P 500 was lower 3 months later 14 of the days by a median of -3.7%. The only positive return was the 1 point gain following the March 2015 occurrence.
All in all, this may not be a Defcon 5 level red flag for the market. However, for a rally that has seen scant evidence of exuberance, this is at least one of the first indications of complacency.
Thanks for reading.
Further reading from Dana: “Is The Nasdaq 100 Running Out Of Steam?“
Twitter: @JLyonsFundMgmt
Any opinions expressed herein are solely those of the author, and do not in any way represent the views or opinions of any other person or entity.


