March 8 stock market futures finally dipped into support zones. The S&P 500 futures declined to 1981-1984 before rebounding slightly.
There is congestion all the way up to 1994.5, and if breached and held, we’ll retest 1999 to 2000.25. Price action across stock market futures is extended, which points to either a lull in movement, or a drift into deeper support. Range expansion into higher levels are not likely to hold, and will continue to give us countertrend shorts into support.
Momentum on the four hour chart is negative. Daily charts continue to show momentum as trending positive, though somewhat flattening, and in positive territory.
Shorter time frame momentum indicators are sloping down, but looking weaker. 1981.25 – 1984.5 is the support region to watch for sellers to test and for buyers to hold if this chart fails to move forward- so far, it is holding well as buyers continue to frustrate sellers looking for continued shorting action.
See today’s economic calendar with a rundown of releases.
THE RANGE OF TUESDAY’S MOTION
Crude Oil Futures (CL_F)
Outlook for Mar 8, 2016 -CL_F – Charts continue to rise as we stretch into major resistance. We now have new levels of resistance here at 38.4, but momentum levels that suggest an upside press once more is ahead into the region between 38.58 and 39.60
Today, the trading ranges are between 37.12 and 38.98. Expansions outside those zones will retest the range levels, and if held, will advance in the direction of the break. Use the 1hr chart to assist there.
Moving averages in oil show us with rising positive momentum on longer time frames. This generally gives rise to buyers showing up when it seems like the chart will roll. Support holds tightly at 36.05
Intraday long trade setup suggests a long off 37.12 positive retest, or 37.35 positive retest into 37.75, 37.96, 38.2 and if buyers hold on, we’ll see 38.42, and 38.7 to potentially 38.94.
Intraday short trade setup suggests a short below a 37.94 failed retest with negative divergence, or the failed retest of 37.34 sends us back through targets at 37.12, 36.8, 36.59, 36.2, 36.08, and back into familiar regions seen near 35.3, if sellers hang on.
Have a look at the Fibonacci levels marked in the blog for more targets.
E-mini S&P 500 Futures (ES_F)
Below is a S&P 500 futures chart with price support and resistance trading levels for today. Click to enlarge.
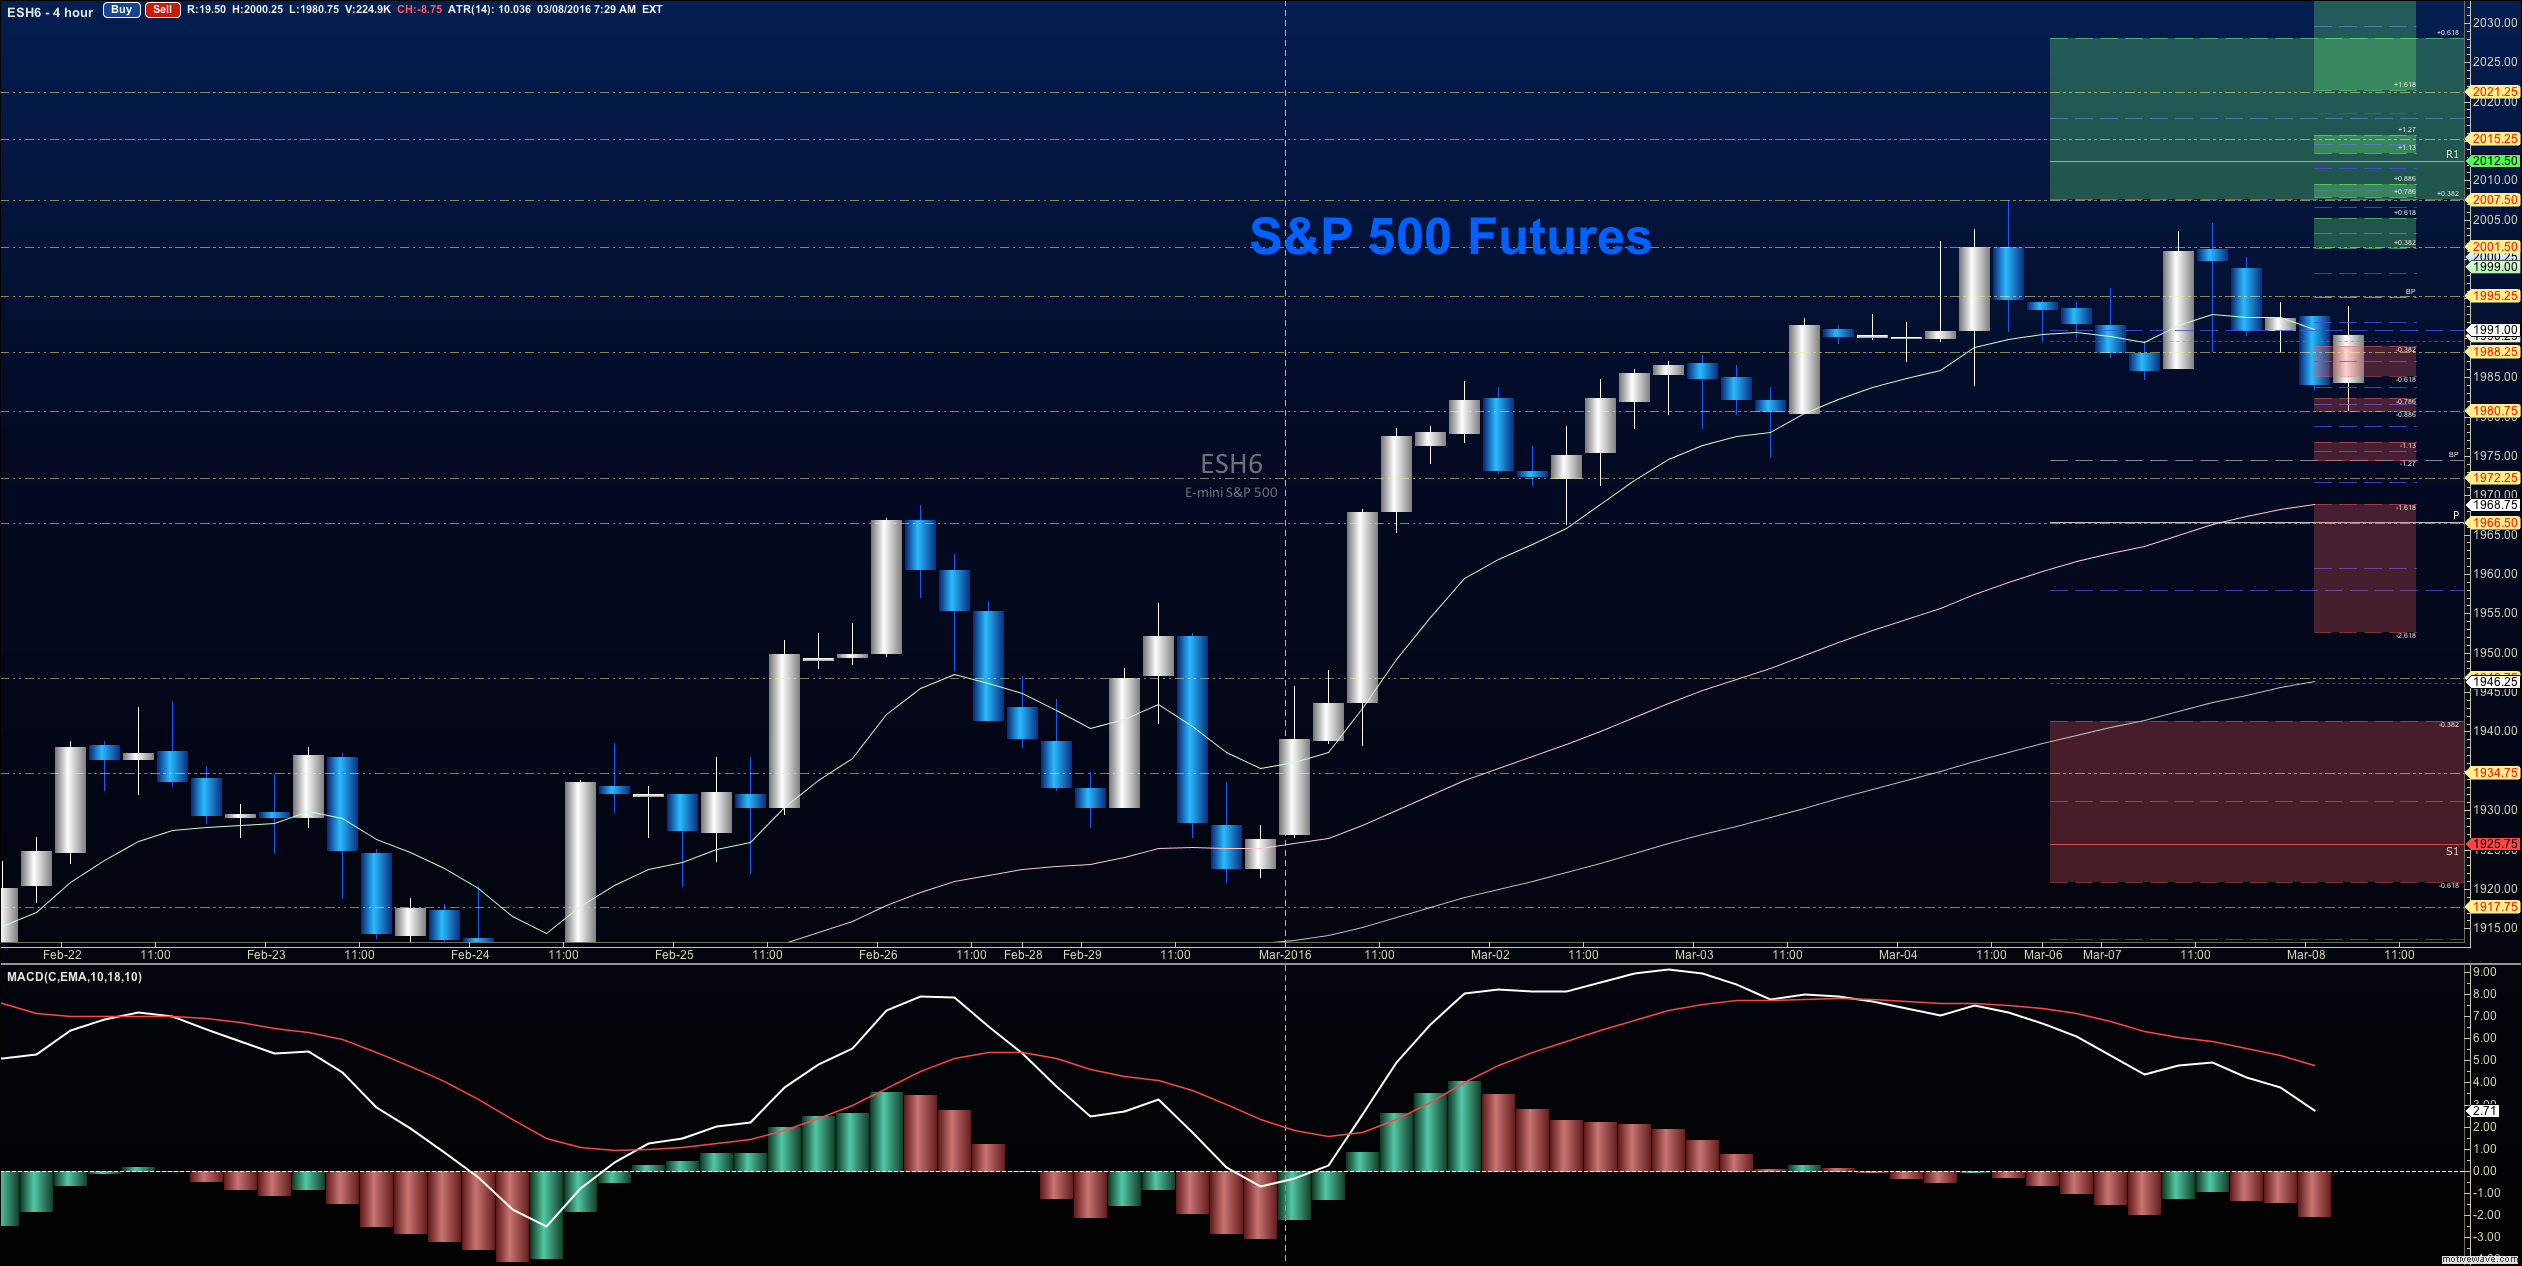
S&P 500 futures outlook for March 8 – Charts have continued receding from Friday’s highs and finally tested the support targets of 1981-1984. If the chart fails to recapture and hold 1994.5, the region of 1981-1984 remains a congested zone and if lost, we have those levels near 1968 to look toward as targets. The S&P 500 futures chart will be vulnerable to selling below 1984, if it does not quickly recover after a test of that level.
Upside motion has the best setup on the retest of 1987.75 or a breach of 1994.5 with positive momentum. I use the 30min to 1hr chart for the breach and retest mechanic. Targets from 1994.5 are 1997.25, 1999, 2000.25, and if we can catch a bid there, we could expand back into 2003.25 and beyond. The next big resistance test sits at the region between 2011-2015, then 2021-2025. Watch the higher lows to keep you on the right side of the long trade. Charts are firming up, but expect pullbacks into higher support.
Downside motion opens below the failed retest of 1984 or at the failed retest of 1999 with negative divergence – but really watch for the higher lows there- the higher lows will signal that your short is ill positioned. Retracement into lower levels from 1984 gives us the targets 1981.5, 1974.75, 1971.25, 1969.25 and perhaps 1964.5 if selling really takes hold.
Have a look at the Fibonacci levels marked in the blog for more targets.
If you’re interested in the live trading room, it is now primarily stock market futures content, though we do track heavily traded stocks and their likely daily trajectories as well – we begin at 9am with a morning report and likely chart movements along with trade setups for the day.
As long as traders remain aware of support and resistance levels, risk can be very adequately managed to play in either direction as bottom picking remains a behavior pattern that is developing with value buyers and speculative traders.
Thanks for reading.
Twitter: @AnneMarieTrades
The author trades stock market futures every day and may have a position in mentioned securities at the time of publication. Any opinions expressed herein are solely those of the author, and do not in any way represent the views or opinions of any other person or entity.


 Ready To Break Out?")
