It’s been a rocky ride thus far for the major stock market indices in 2015. Just 3 weeks ago I wrote about the resistance levels for the Dow Jones Industrial Average (DJIA), NASDAQ Composite (COMPQ), S&P 500 (SPX) and the Russell 2000 (RUT). I purposely did that post at that particular time because all 4 major stock market indices were at what I deemed “make or break” levels. Simply put, they were all at resistance levels that would either push them down or they would break out above and continue upward in this raging bull market that started in early 2009.
At that time, using my Fibonacci method, these were the resistance levels I was watching (again, those levels can be seen in my post from December 31st).
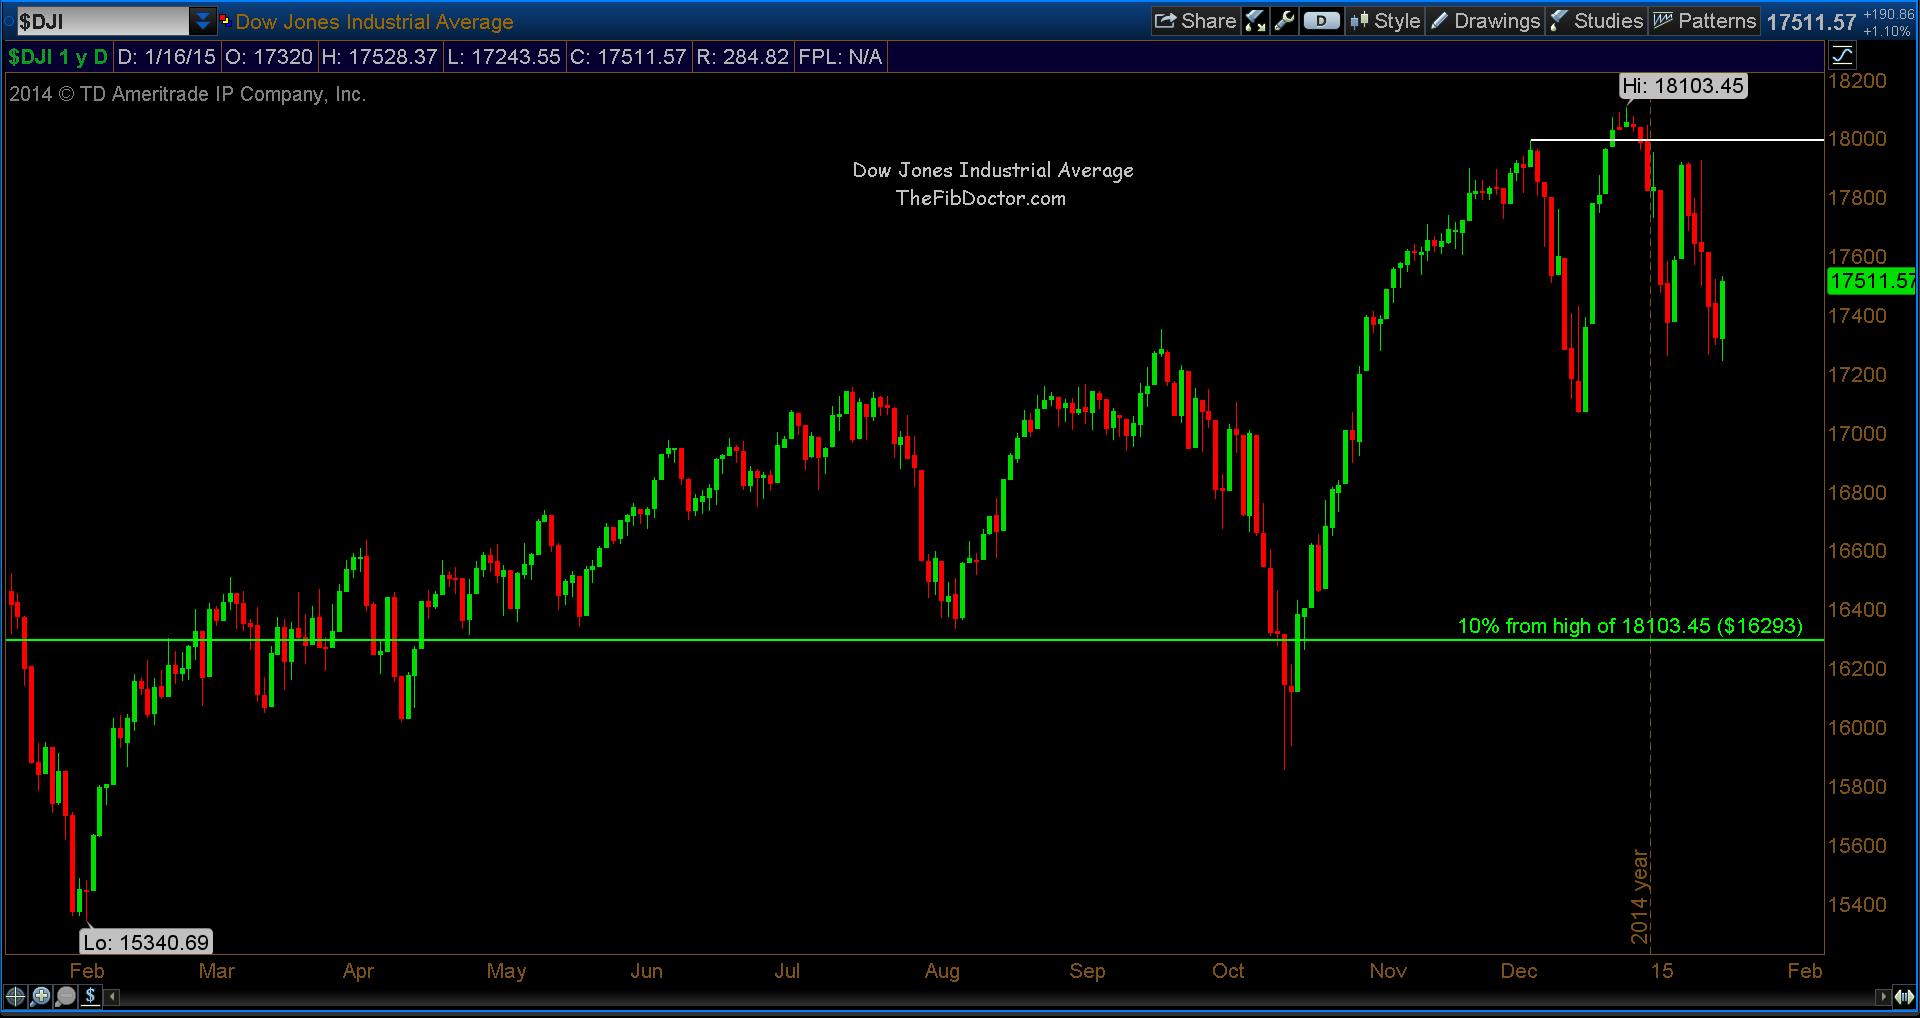
- DJIA Resistance = 17991.19 High = 18103.45
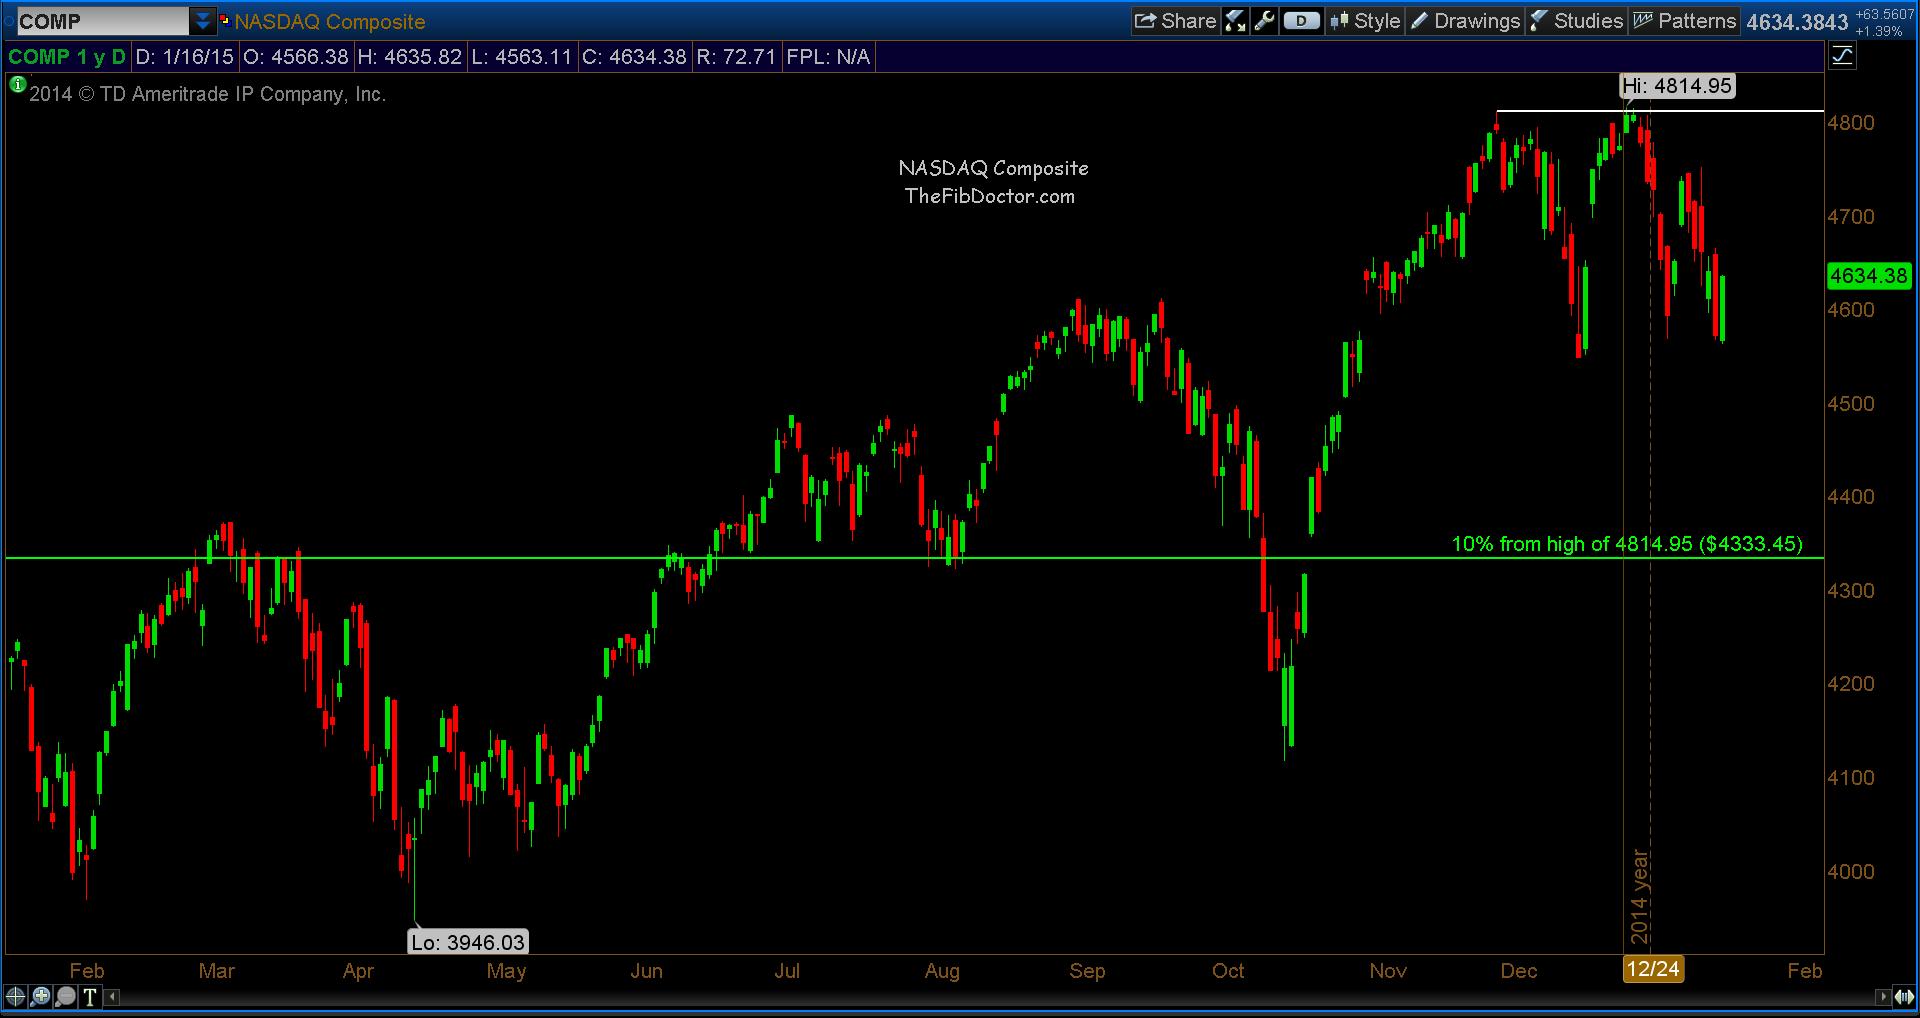
- COMPQ Resistance = 4810.86 High = 4814.95
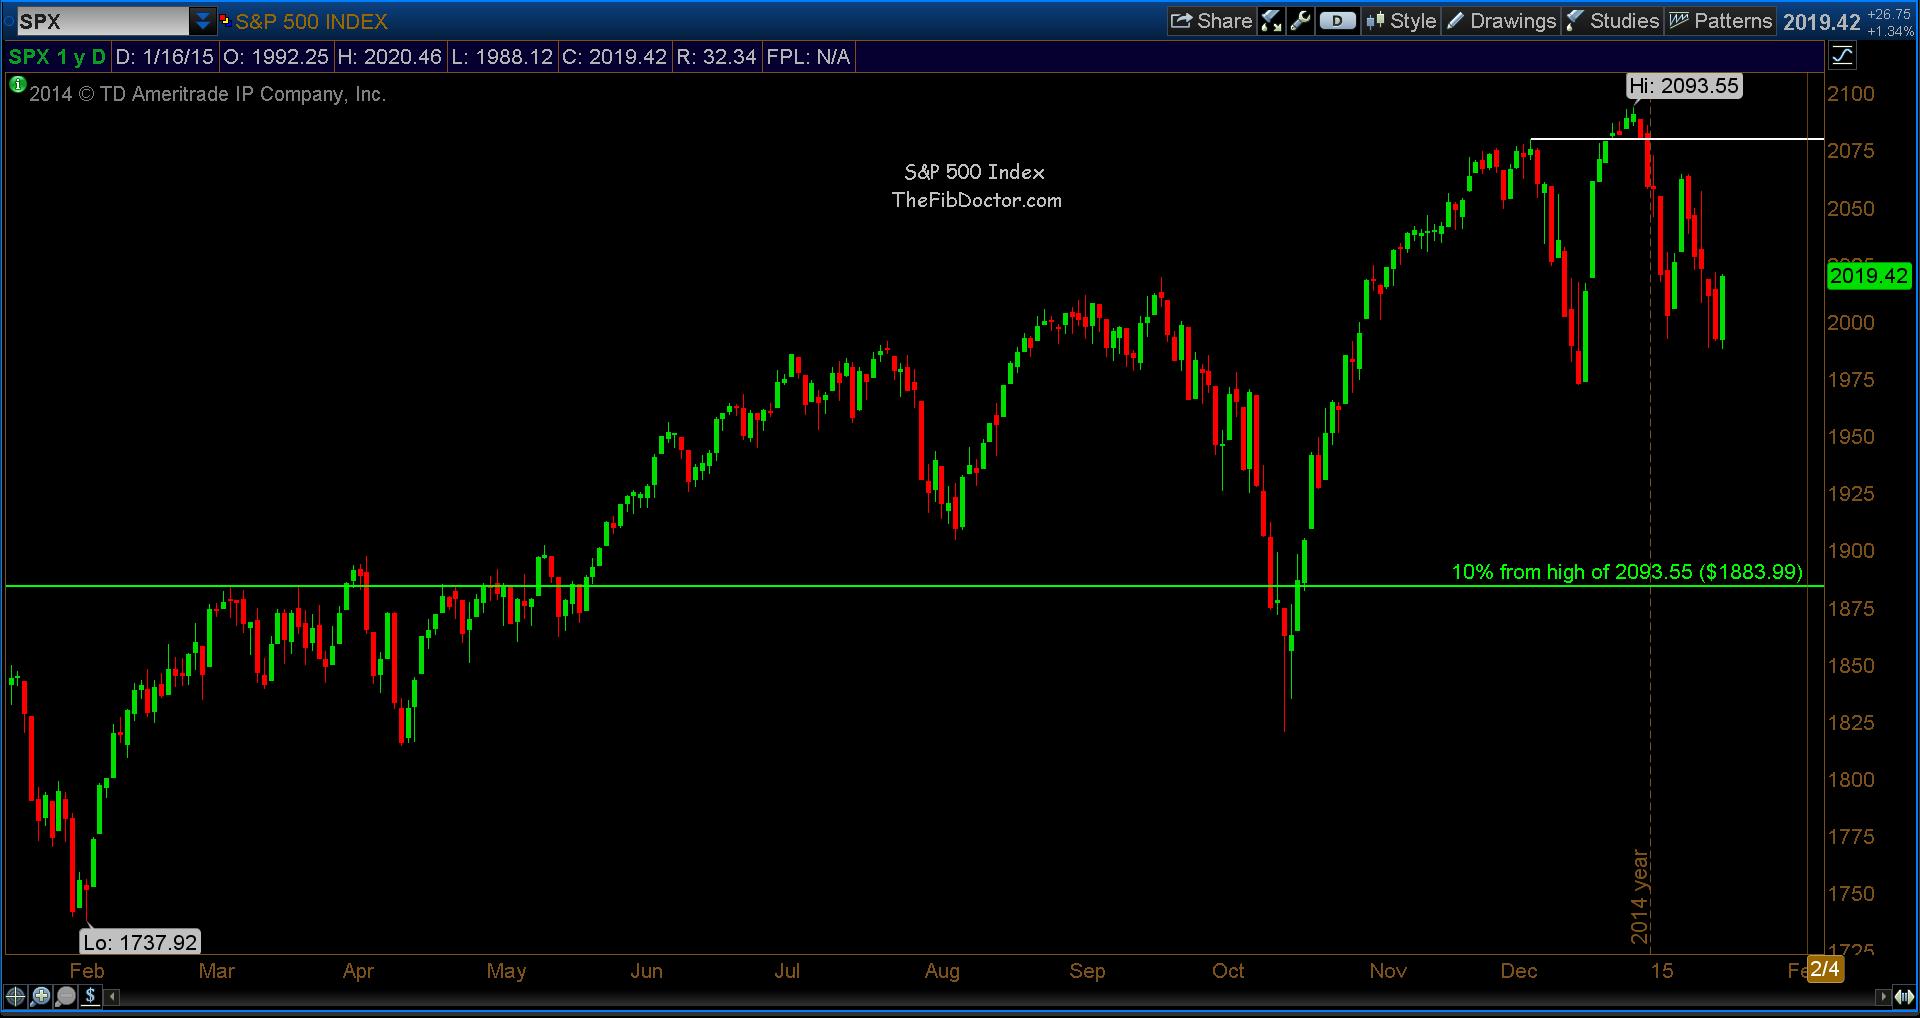
- SPX Resistance = 2079.47 High = 2093.55
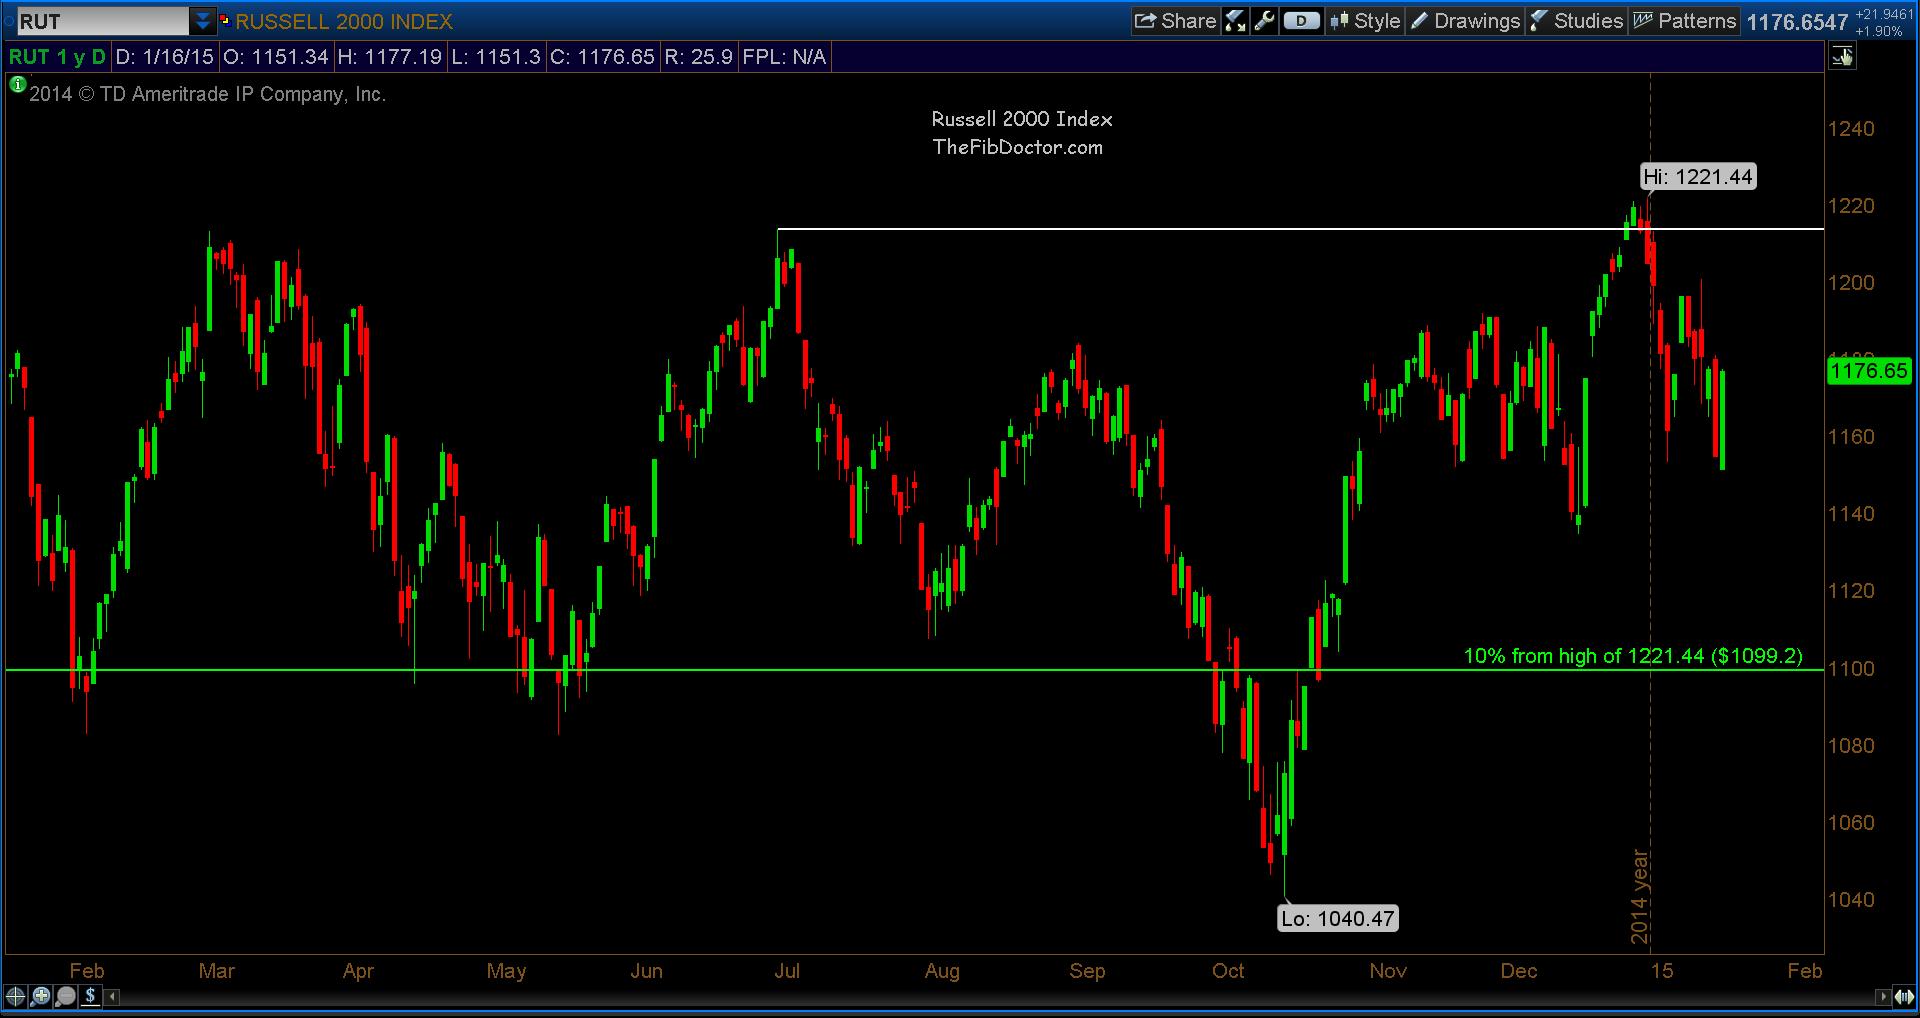
- RUT Resistance = 1213.55 High = 1220.81
Now, let’s check back in on the four major stock market indices to see if they broke out or pulled back at these resistance levels. Let’s start with the Dow Jones Industrial Average.
In the 1 year chart below, you’ll see that the Dow has not made a new high and has pulled back (4.75%). A technical correction of (10%) would be at 16293.
Dow Jones Industrial Average – 1 Year Daily chart
Now let’s look at the NASDAQ Composite. In the 1 year chart below, you’ll see the NASDAQ has not made a new high and has pulled back (5.23%). A technical correction of (10%) would be at 4333.45.
NASDAQ Composite 1 Year Chart
Similar story with the S&P 500. In the 1 year chart below, you’ll see the S&P 500 has not made a new high and has pulled back (5.03%). A technical correction of (10%) would be at 1883.99.
S&P 500 Index – 1 Year Daily chart
And last, but certainly not least, the Russell 2000 made a new high of 1221.44, a minute increase of only +0.05% above the previous high. A technical correction of (10%) would be at 1099.2.
Russell 2000 Index – 1 Year Daily Chart
If the market continues to pull back, watch for support at these (10%) correction levels as they will be high probability support numbers. And by the same token, if the market starts a march forward, the previous resistance levels will apply as well.
Thanks for reading and always use a stop!
Follow Dave on Twitter: @TheFibDoctor
No position in any of the mentioned securities at the time of publication. Any opinions expressed herein are solely those of the author, and do not in any way represent the views or opinions of any other person or entity.


