It’s inevitable, every time investors start to “look” higher, the market reverses and punishes them. This has happened several times in 2015 as the markets have been volatile and choppy. But with the stock market back near all time highs, a major S&P 500 Fibonacci target comes into play again.
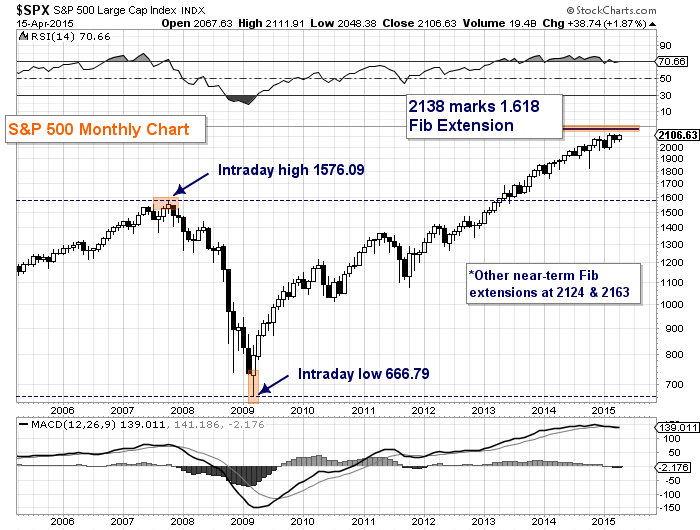
Back in late February, I posted about the 1.618 Fibonacci extension from the ’09 lows back above the ’07 highs. This level (using intraday highs and lows measures to 2138. No need to split hairs here, the 2130-2160 area is chalk full of key fibonacci resistance levels. I wouldn’t be surprised to see the S&P 500 reach up into this area (or even higher briefly) at some point this spring.
Below is an updated chart highlighting this major S&P 500 Fibonacci target. As you can see, RSI has been above 70 for some time, but momentum is looking heavy. This could set up a divergence if price hits higher highs and strength indicators begin to fade.
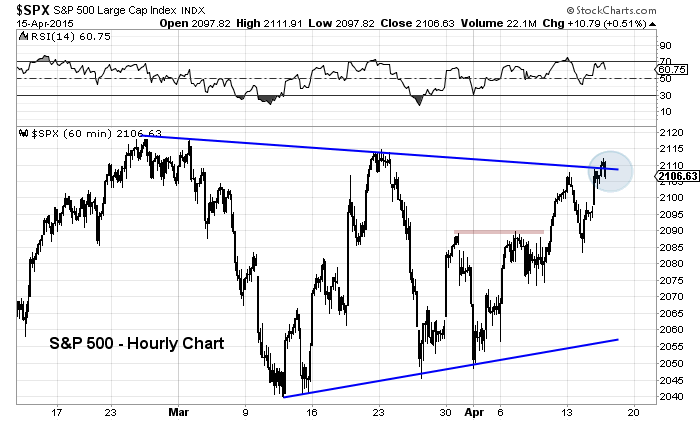
To have a chance at reaching higher price levels, the S&P 500 will first need to put in a clean breakout above wedge resistance, In the chart below, you can see that the major index closed right at resistance. Many investors will be watching this level in the days ahead.
Follow Andy on Twitter: @andrewnyquist
No position in mentioned securities at the time of publication. Any opinions expressed herein are solely those of the author, and do not in any way represent the views or opinions of any other person or entity.


