It’s the rally that just doesn’t want to exhale. And this morning the S&P 500 (SPX – Quote) has taken market shorts to the brink. Futures are up about 16 points, reaching as high as 2070.95 over night. What set off this overnight euphoria? The same thing that occurred just 3 weeks ago out of Japan… yup, more easing. This time it comes courtesy of China, as the Chinese central bank decided to cut benchmark interest rates for the first time since 2012 last night.
So where does this put the S&P 500 rally in terms of price targets and current health? Well, by all indications, the cash index will open up around 2070 and this will put the index near its first Fibonacci extension target, the 1.272 target on the S&P 500 at 2073. This could take some steam out of the rally, but I always like to give gap higher events a 3 or 4 sessions to run before looking for downside (or gap fill). But in this case, with the index up almost 14 percent off the October lows, it may not have legs much beyond Monday or Tuesday before some selling sets in. As well, with the RSI near 70, I’m speculating that today’s rally will push it into overbought territory.
For more on why 2070ish (or 207 on the S&P 500 etf, SPY – Quote) is important, be sure to read Andrew Kassen’s Fibonacci sequence piece.
So would this eventual selling give way to another correction? Not so fast. Another popular Fibonacci extension target is the 1.618, which targets 2142 on the S&P 500. This would likely only come into play should the S&P 500 pullback and re-energize sometime over the next couple weeks.
S&P 500 Daily Chart with Fibonacci Extension Targets
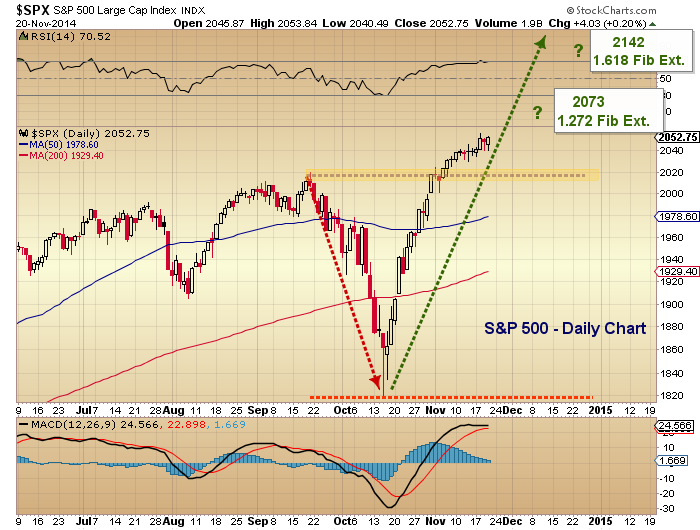
Now, let’s cover a few support levels. Well, since the rally hasn’t seen a short-term peak as yet, I can’t calc any Fibonacci retracements. But the obvious lateral support levels come in to play at recent consolidation 2030-2035, followed by the breakout level and big round number 2000-2020. Lastly, the 50 day moving average resides at 1978 and rising.
Trade safe.
Follow Andrew on Twitter: @andrewnyquist
The author holds a net short exposure to the S&P 500 at the time of publication. Any opinions expressed herein are solely those of the author, and do not in any way represent the views or opinions of any other person or entity.

 Rolling Over At Key Fibonacci Level?")


