It’s been a nice run higher for stocks over the last month. After retesting the August lows on September 29th, the S&P 500 is up over 200 points in a month. That’s a big move and it begs the question: What now?
Well, since I’m a trader, I’m going to focus on my expectations for the near-term, mixing in a few intermediate-term thoughts.
Although market breadth is improving and the recent thrust higher in the S&P 500 has recaptured the 50 and 200 day moving averages (bullish indicators), the market is getting overbought here. I no longer have any swing trades open and will be focusing on taking very short-term day(s) trades in the days ahead. Furthermore, I will be looking to get short the market if it stays elevated later this week or early next week.
Some might ask, why would you wait to bet against the stock market indices if you feel they are extended? That answer is two fold:
- I’m patient. Sometimes the best opportunities come when stretched becomes more stretched. After 17 years of trading, I’ve learned that patience and high quality entries limit my risk. The idea of missing out on a trade, or in this case the early stages of a trade to the downside (or upside) doesn’t get me excited any more. Boring is better I’ve learned. Note as well that the Relative Strength Index is at 67 – I’d prefer to see that over 70.
- The Fed is on tap today so I expect a lot of noise over the next few days. Therefore, the market’s directional interest may not fully show it’s head until next week.
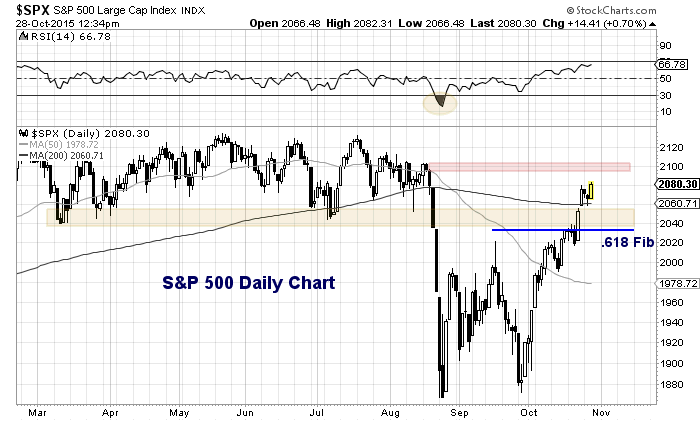
Turning to the chart of the S&P 500, you can see what a spectacular move the market’s have made in October. As I mentioned above, the index is nearing overbought with its RSI around 67. There is still room to move back up to or just above 2096.92 (open gap) – that is the scene of the crime, where the breakdown in the market began.
To put that in perspective, it’s only 1 percent above current prices. As well, the S&P 500 Index is on bar 5 of a potential 9 sell setup. If the market can muster a bit more strength into next week, the market could put in a short-term top Monday or Tuesday and begin a pullback. Or, alternatively, the market could begin a pullback late this week and retest this week’s highs next week (another good short trading setup).
Once underway, I’d look for a pullback to minimum 2050, with a strong possibility of testing 2000-2020 area. A deeper support levels resides at the 50 day moving average (currently 1980) but there isn’t much support beneath that. Much will depend on the behavior of the price action after a pullback commences.
S&P 500 Daily Chart
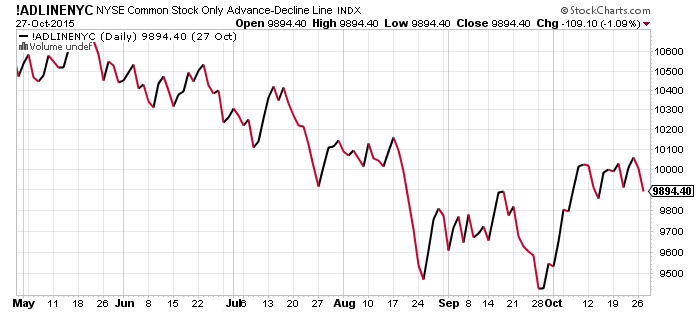
Lastly, market breadth is languishing a bit (see chart of NYSE Advance-Decline Line below). This is a near-term divergence with stocks.
NYSE Advance-Decline Chart (common stock only)
I think we’ll have a better idea of what the market is up to after we see how it reacts to the next pullback. Thanks for reading.
Twitter: @andrewnyquist
No position in any of the mentioned securities. Any opinions expressed herein are solely those of the author, and do not in any way represent the views or opinions of any other person or entity.


