My hiatus from writing is officially over. And I can’t say that I missed a lot. At least from a price perspective. The S&P 500 (INDEXSP:.INX) has been stuck in 2nd gear since breaking out last July and can’t seem to find follow through (read Steve Deppe’s awesome post from earlier today on this).
Is it the presidential election? Is it geopolitical tensions? Is it the blah global economy? Probably all of the above… and more. This all gets factored into “price” on a day by day basis.
And looking at the chart below, it’s clear that investors are uncertain. This lack of commitment is seen not only on the S&P 500, but via related “risk-on” and “risk-off” assets. After gold shot higher, it’s taken a step back. And during this step back, Crude oil has moved higher and the 10 year treasury yield has rallied. So stocks are rallying too, right?
Wrong. There’s that lack of commitment thing.
The market is just 3 percent off all-time highs but has struggled to gain traction in attempting to rotate from defensives to cyclicals. This is looking like a process… and it may resolve with lower prices.
So what are investors waiting on? Price. Always. It’s the final arbiter. It confirms the action that we are seeing… as David Blair says, we’re in a “trading box” until we’re not.
My quick technical thoughts:
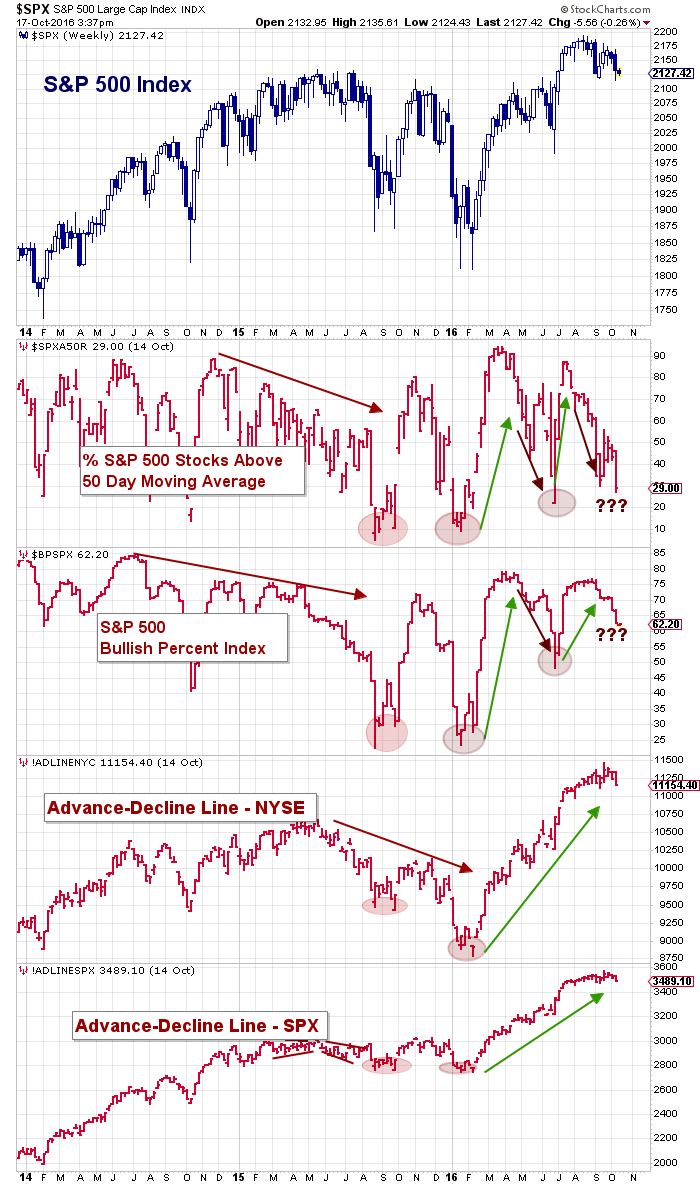
- The market looks heavy. Breadth is weakening (2nd chart below) and even those holding up are rounding. It would be great to get a “flush” – even if it’s just 3-4 percent over a few days. This could provide a reset for bulls.
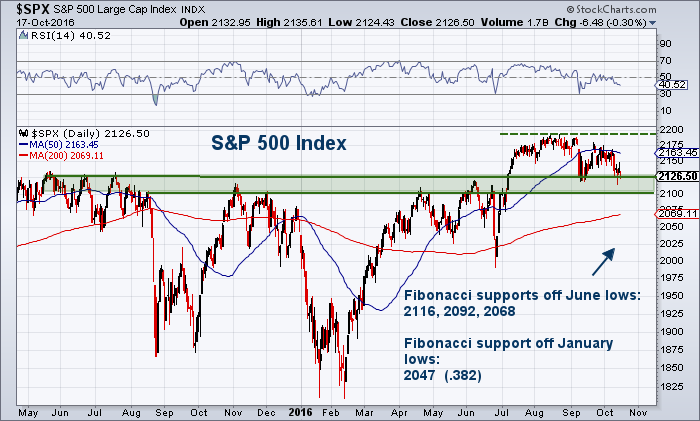
- 2100 to 2125 is lateral technical support dating back 18 months.
- If broken, Fibonacci support levels off June lows are: 2116.6 (.382 Fib), 2092.75 (.500 Fib), 2068.89 (.618 Fib).
- The 200 day moving average is at 2069.
- Fibonacci support levels off January lows: 2047.24 (.382 Fib).
Bottom line is that price is holding up in spite of some under the hood uncertainty, etc… U.S. equities have held up relatively well in the face of several worries (especially vs. other developed markets). I think a pullback would welcome and healthy here. And that’s not in a “doomsday” voice. 😉
It’s a rangebound market with price above 2100. However, a move under 2100 would likely target the .618 Fib and 200 day moving average at 2069; then push the 2047 (.382 Fib of Jan lows).
Charts for reference:
Thanks for reading.
Twitter: @andrewnyquist
Any opinions expressed herein are solely those of the author, and do not in any way represent the views or opinions of any other person or entity.

 Rolling Over At Key Fibonacci Level?")


