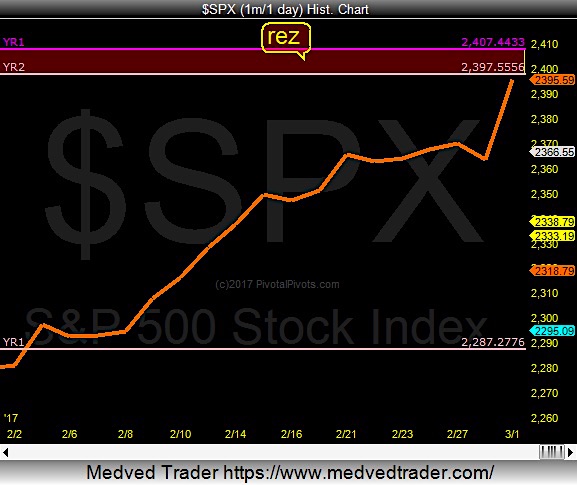
Yesterday’s rally higher saw the S&P 500 Index (INDEXSP:.INX) test important an important resistance area: the confluence of S&P 500 yearly trading pivots for 2017.
And traders should put this on their radar.
The average pullback at these Yearly pivot points is 100-120 points. From this area (2398 to 2408), I see risk down to the S&P 500 Fibonacci Yr1 Pivot @ 2287 in March.
S&P 500 Yearly Trading Pivots Chart
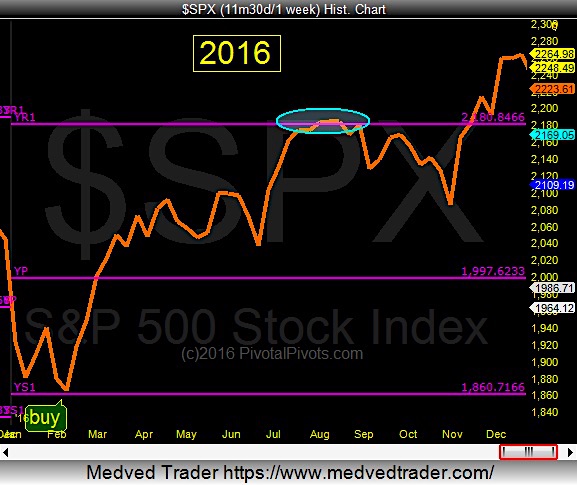
In 2016 the S&P 500 Index pulled back exactly 100 points after testing the Yr1 Pivot(see 2016 chart below).
The rally turns 8 years old this week. My 2017 prediction is the US Markets will top out in the spring/summer of 2017.
Thanks for reading and trade the pivots!
Twitter: @Pivotal_Pivots
The author may have a position in mentioned securities at the time of publication. Any opinions expressed herein are solely those of the author, and do not in any way represent the views or opinions of any other person or entity.


