The S&P 500 Index remained within a bullish rising channel for several months (highlighted in blue below).
But on August 21st, the S&P 500 broke through the bottom side of this channel, breaking a two year pattern while turning a major technical support level into a key stock market resistance level. click chart to enlarge
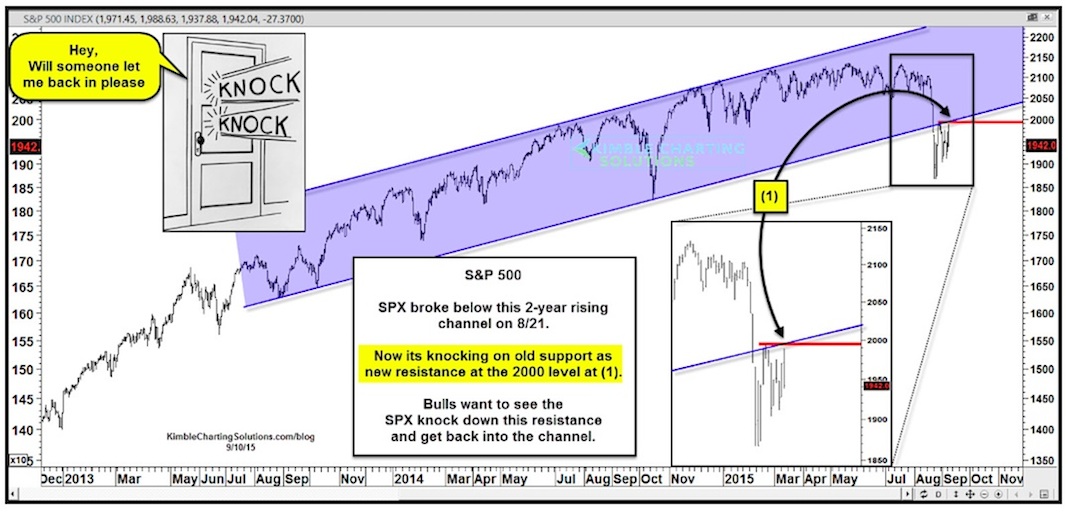
In the weeks following the breakdown, the S&P 500 has attempted to rally a few times, knocking on the underside of this prior support level (which now serves as key stock market resistance).
One of those attempted rallies came yesterday when the S&P 500 opened the morning session with strength. It came very close to the underside of the channel and reversed lower, creating a reversal pattern commonly known as a bearish wick. Again, this came in near the 2,000 mark at point (1) on the chart above.
The 4 to 5 year rising channel trends are still in play, yet the shorter-term 2-year channel has been broken to the downside.
Can the S&P 500 climb back above this new stock market resistance level? And more importantly, hold above that level?
Well, if the S&P 500 is going to continue higher, it will need to do just that. And that is why my eyes will continue to stay focused on that 2,000 level.
Thanks for reading and best of luck out there.
Twitter: @KimbleCharting
Author does not have a position in any mentioned securities at the time of publication. Any opinions expressed herein are solely those of the author, and do not in any way represent the views or opinions of any other person or entity.


