The big stock market rally that began in January has taken a breather in the last few weeks. It’s times like these that I can step back and look at at the returns from various types of stocks and bonds to get a feel for how the overall market is shaping up. From stocks to bonds to emerging markets and commodities, I like to get a gauge for what is performing well and where we may see the next rotation.
Here is a list of a few things that I like to look at:
- large caps versus small caps
- US stocks versus non-US
- developed markets versus emerging markets
- interest rate sensitive bonds versus credit sensitive bonds
- REITs and precious metals equities
The returns from late January through late April were very strong for all of these asset groups. Small caps, emerging markets, and precious metal stocks did very well. The gold miners ETF ($GDX), was up nearly 100% in this three month timeframe. There was clearly a strong risk appetite in the marketplace, with the US Dollar underperforming, giving a boost to emerging markets and precious metal stocks. The US Dollar Index fell about 5% in this stretch.
More recently since late April, all of these asset groups has struggled. Only REITs and “the long bond” (long-term treasury securities) have provided modest positive returns.
So where do we go from here? Anyone’s guess, however there are a pair of interesting chart setups that bear watching. Both involve the well-known head and shoulders pattern. One is a traditional head and shoulders on S&P 500 ETF ($SPY), the other is a bullish reverse head and shoulders on the Emerging Markets ETF ($EEM).
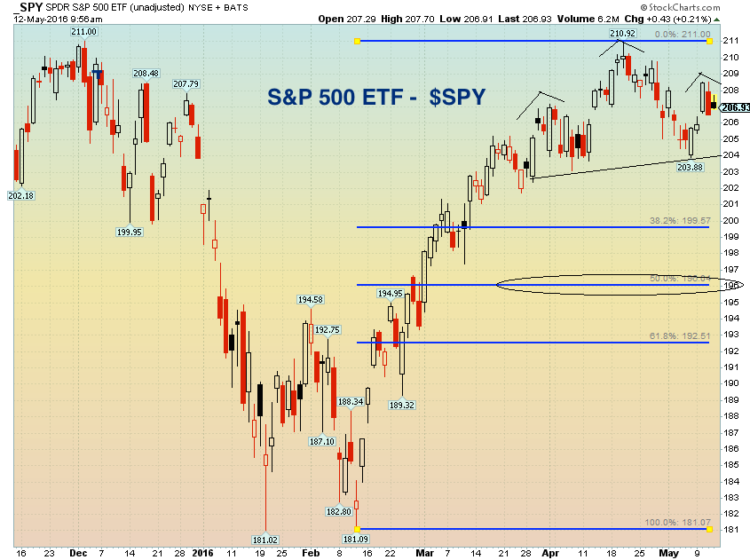
SPY shows a near-term head and shoulders corrective pattern since March. Novice technicians may take a pause here when they see the words “head and shoulders” and “corrective” in the same sentence. A head and shoulders is traditionally thought of as a reversal pattern, not corrective, however either can be the case. On the SPY chart, we could certainly see a head and shoulders corrective pattern take place, while the trend of larger degree since January remains bullish for stocks.
On the chart below, the simple calculated measured move would have confluence with the 50% retracement off the February (and January) low to the April high. The price target once the neckline around $204 breaks would be about $196.
S&P 500 ETF ($SPY) Chart
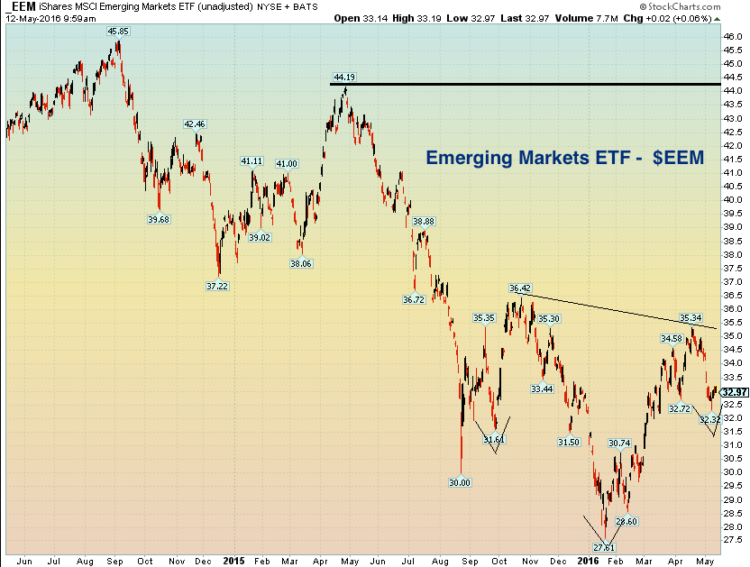
EEM shows a bullish head and shoulders bottom pattern. The chart below is a 2-year look for Emerging Markets, so it is a longer-term perspective than the SPY setup. The measured move price target would take EEM right back to the spring 2015 high above $44.
Emerging Markets ETF ($EEM) Chart
Thanks for reading!
Further Reading: Natural Gas Poised To Rally On Technicals, Seasonality (Apr. 4)
Twitter: @MikeZaccardi
The author has a position in mentioned securities at the time of publication. Any opinions expressed herein are solely those of the author, and do not in any way represent the views or opinions of any other person or entity.


