 By Andrew Nyquist One indicator that often flies under the radar that I believe is a useful one to track and follow is the Bullish Percent Index. This index is a breadth indicator that highlights the number of stocks within an index that are on point and figure buy signals. The indicator tends to flash caution between 70 and 80 and outright concern above 80. However, as with all indicators, one needs to understand that our perception of irrational can remain irrational for longer than one tends to think. That said, let’s look at the current setup with the S&P 500 and the Bullish Percent Index.
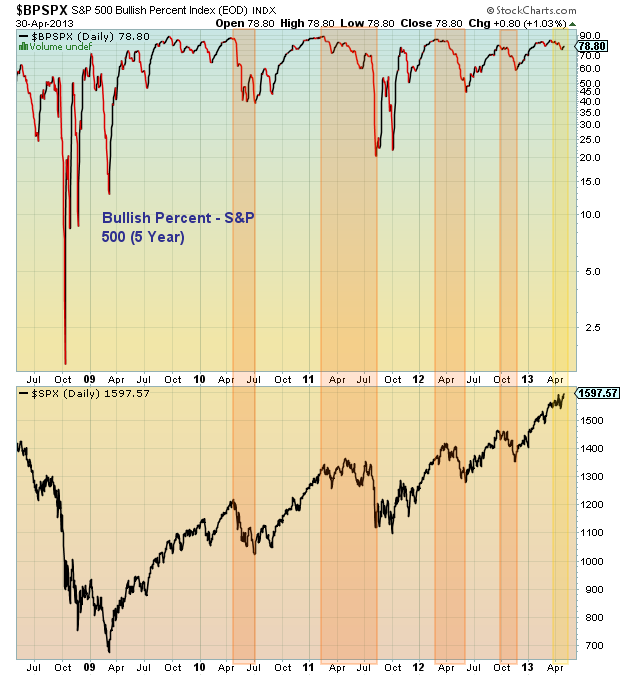
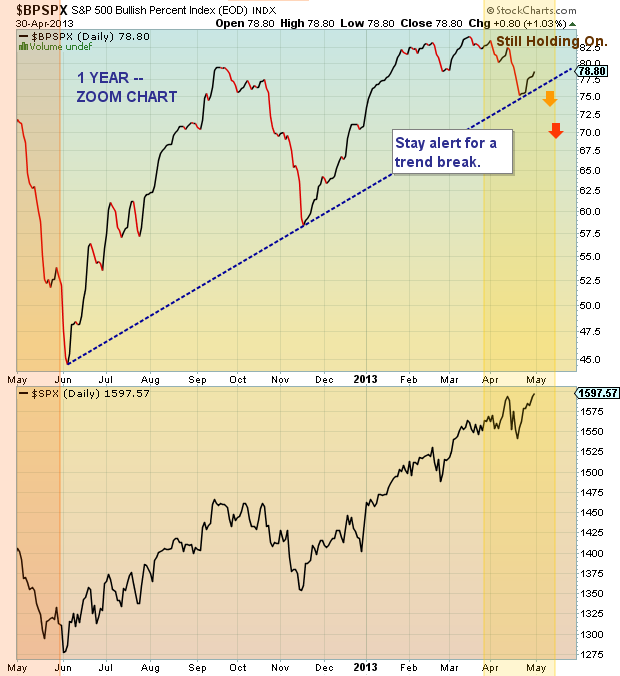
Looking at a longer term chart, it’s easy to see that the S&P 500 tends to begin a topping process as the Bullish Percent Index nears 80 and also tends to turn down alongside the Bullish Percent Index. But the key here, if one is trying to game a “correction,” is to wait for the trend to break. To do that, we need to skip down to the second chart, which zooms in on the Bullish Percent Index. Herein, the index has already turned lower, but has yet to break the trend. Moreover, the S&P 500 trend is still in tact. So, until the two drop and break trend together, investors should simply remain alert, tracking day to day developments.
And with the Federal Reserve and European Central Bank on tap, staying alert shouldn’t be a problem for investors over the days ahead! Trade Safe, trade disciplined.
S&P 500 Bullish Percent Index – 5 Year Chart
S&P 500 Bullish Percent Index – 1 Year “ZOOM” Chart
Twitter: @andrewnyquist and @seeitmarket
No position in any of the mentioned securities at the time of publication.


