A number of analysts and commentators have been discussing the increasingly high levels of the “Shiller PE”, also known as CAPE or PE10, for the S&P 500 Index (INDEXSP:.INX).
Indeed the CAPE has historically been a good predictor of longer term forward equity market returns.
But in this article we’ll take a look at the PE10 for the smaller end of town – small cap stocks. Instead of the S&P 500 we’ll examine the PE10 for the S&P 600 (INDEXSP:SP600).
The chart comes from a broader discussion on the outlook for US Small Cap Stocks in the latest edition of the Weekly Macro Themes report.
The chart shows the PE10 for small caps vs large caps, and there is a considerable gap between them, with small cap stocks trading around a record high valuation level.
PE10 Chart: Small Caps vs Large Caps
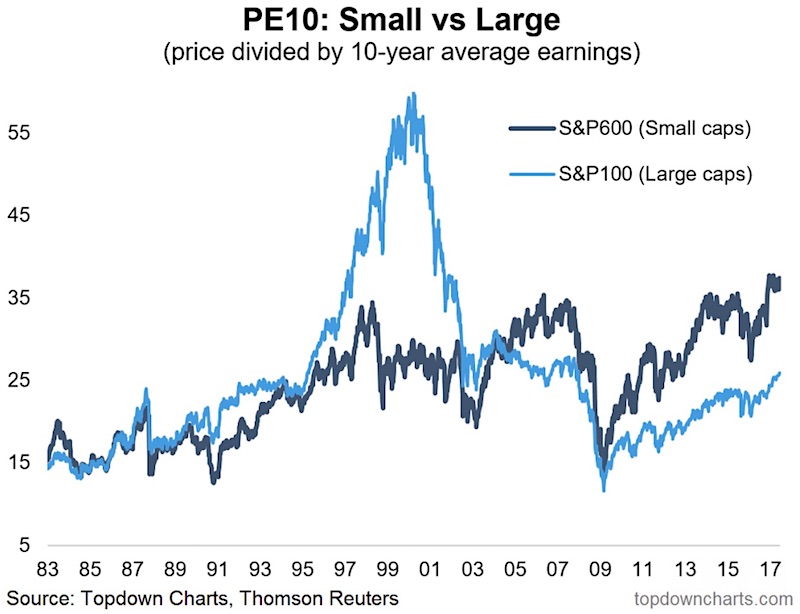
The PE10 as calculated for this graph is price divided by the past 10 years earnings (using historical price and earnings data from Thomson Reuters Datastream).
It is quite remarkable how far small cap stocks have run on a PE10 basis, both relative to large caps, and relative to history. They only previously approached these valuation levels just prior to the financial crisis, and just before the 2015/16 market turmoil. They were left behind during the dot-com boom, but that’s an extreme and different story.
In any case, at least for the S&P 500 several studies have shown that the higher the PE10, all else equal, the lower the future longer term expected returns. Given that small caps are trading at a higher PE10 valuation than usual and higher vs large caps it would be reasonable to expect worse longer term future performance in absolute and relative terms.
Thanks for reading.
Twitter: @Callum_Thomas
Any opinions expressed herein are solely those of the author, and do not in any way represent the views or opinions of any other person or entity.


