Shares of Boston Beer Co (SAM), otherwise known as Samuel Adams, has been in a funk over the past year. In January, Samuel Adams stock peaked at $325 but has since fallen as low as $195 while consolidating around the $200 level. Lower earnings projections have hampered investors all year… but that shows up in the price action.
In short, the domestic brewer and patriot will need to start moving higher soon, or risk another leg lower.
With that said, let’s take a look at the monthly and weekly chart to see what’s in store for Samuel Adams stock, and how traders can play it.
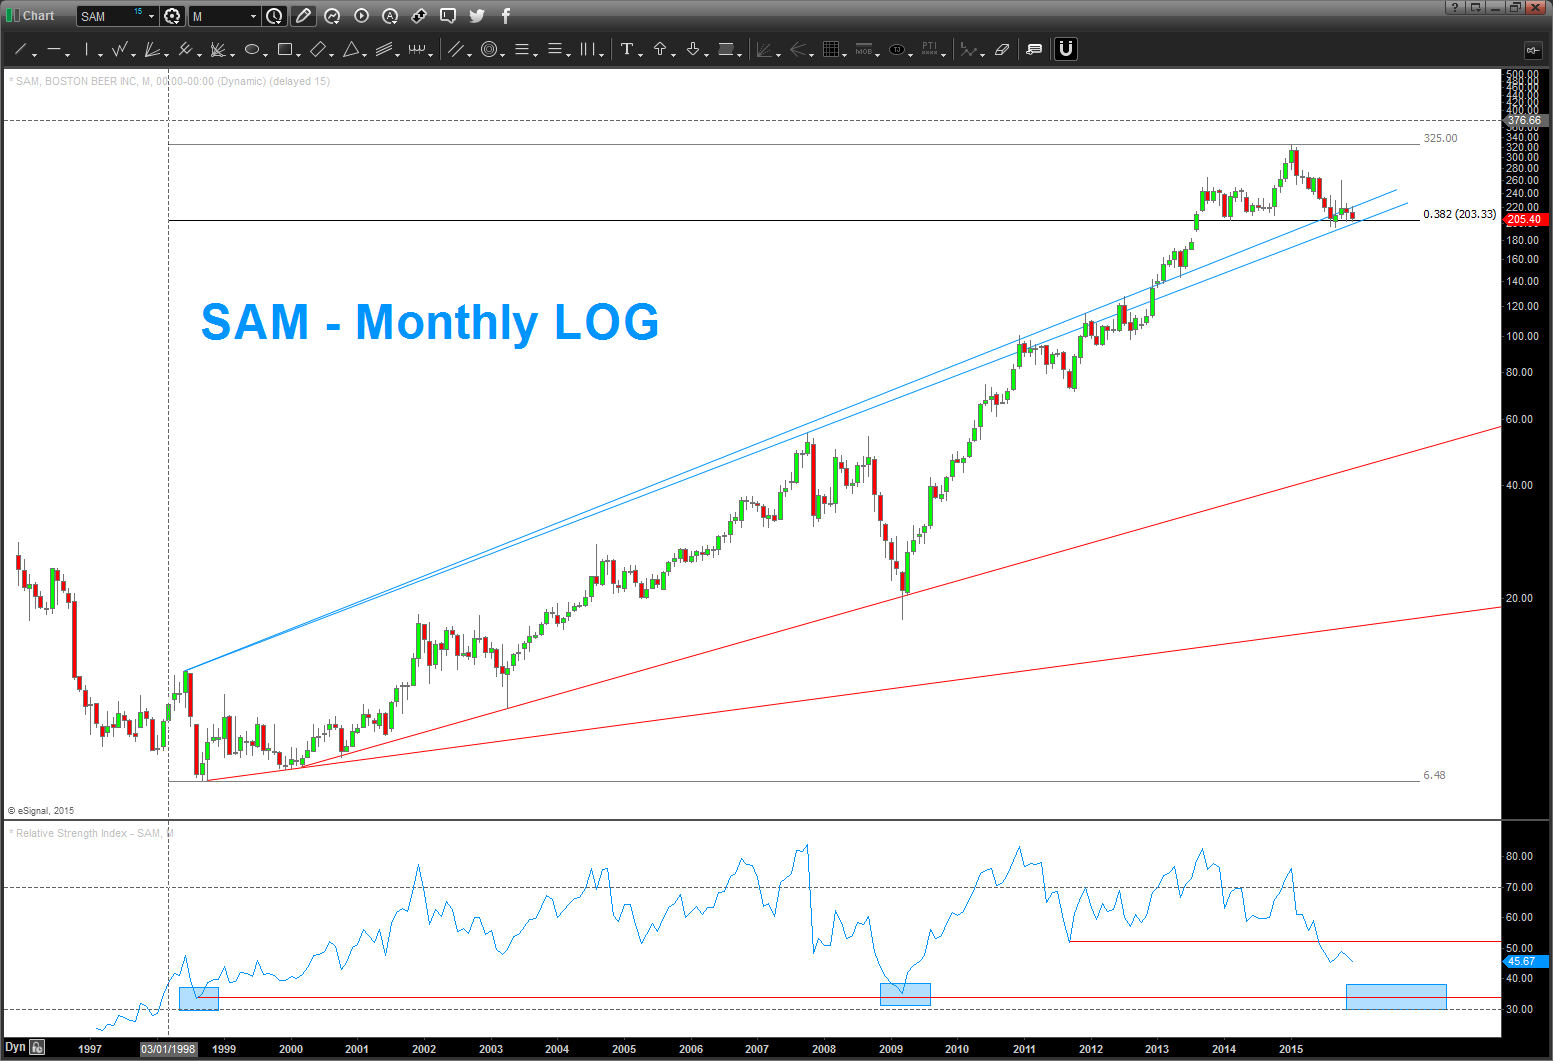
The Monthly Log Scale chart for SAM shows that we are currently at key level for this maker of great beer. Samuel Adams stock price is testing a major trend line and sitting on a key fibonacci support.
- Sitting on the .382 retracement from the 1999 low
- Also sitting on top of the blue trend lines.
- With polarity we can see that resistance has become support.
- Note, key RSI support zone was broken so if we lose the 200 level to the downside then it will, most likely, move to the lower RSI support zone for a potential BUY.
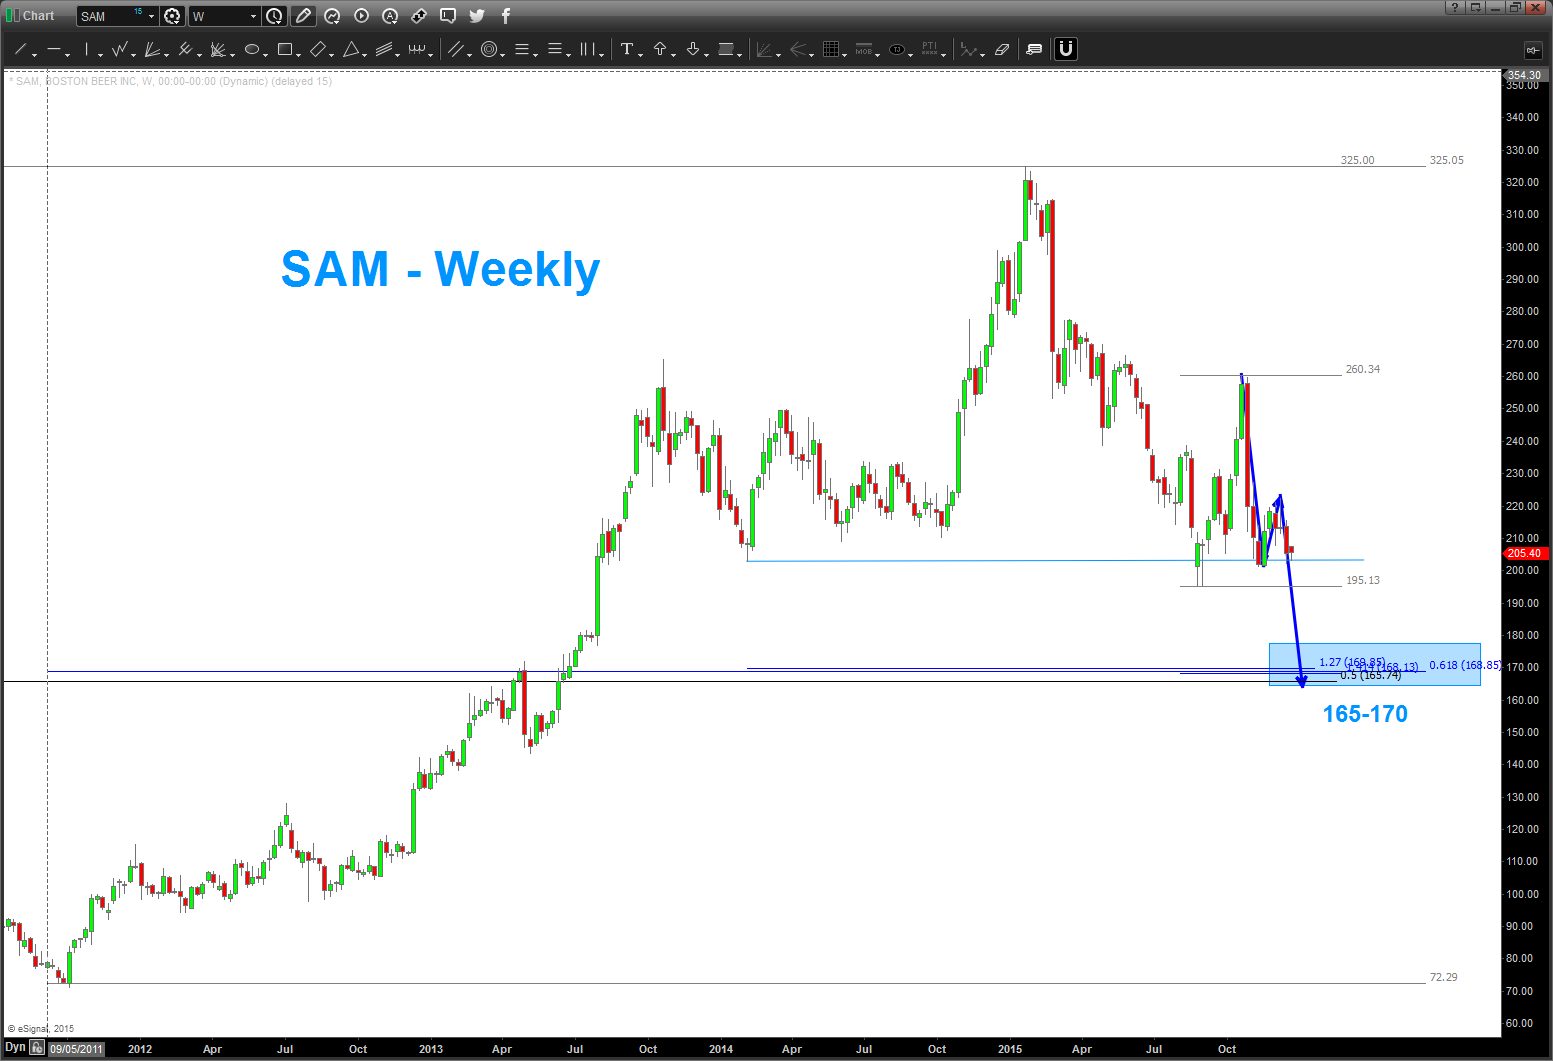
Looking at the weekly chart for SAM, we can see that the brewer is testing horizontal support as well. Below that resides a confluence of Fibonacci supports (but those levels are 15-20 percent lower). So careful here.
- Key horizontal support is being attacked.
- $165-$170 would be a tradable “buy” price target is Samuel Adams stock declines below $195.
Thanks for reading.
Twitter: @BartsCharts
Author does not have a position in mentioned securities at the time of publication. Any opinions expressed herein are solely those of the author, and do not in any way represent the views or opinions of any other person or entity.


