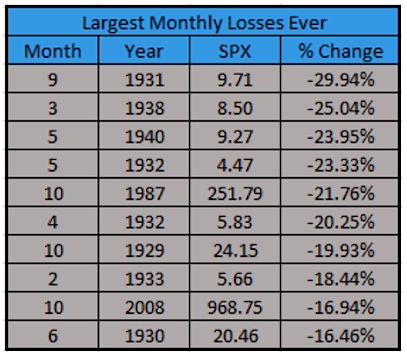
Back to that theme of October stock market volatility… Three of the 10 largest monthly declines ever took place in October.
BUT the worst October only came in at fifth and that was the 1987 Crash.
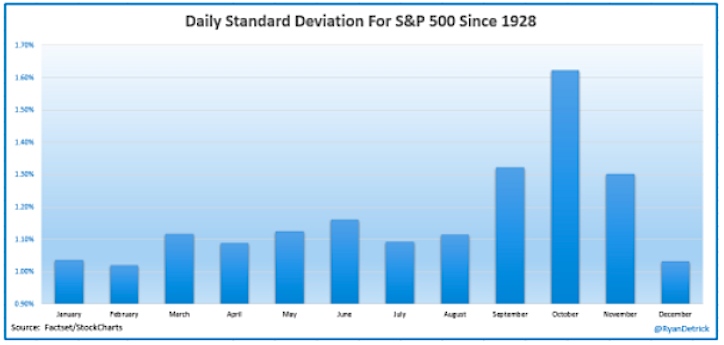
October has the highest daily standard deviation for all months and it isn’t even close.
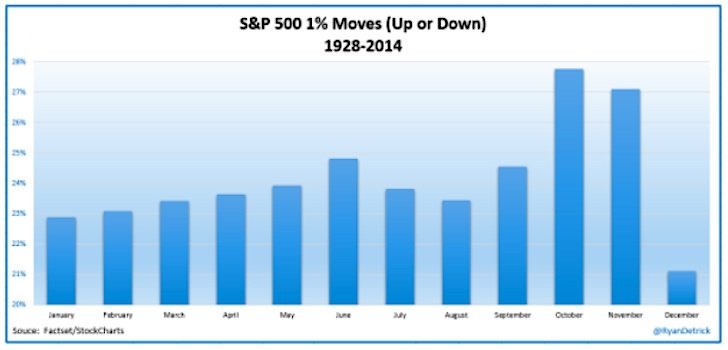
Looking at 1% up and down days, October has a 1% move 27% of the time. No month is higher. After eight days this year, we’ve already seen two. So some market volatility is the norm for October.
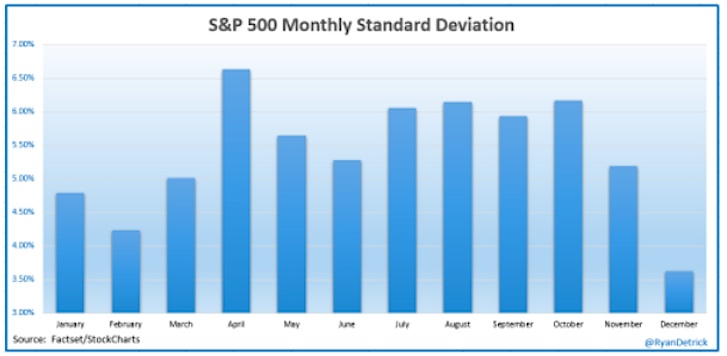
Lastly, looking at stock market volatility on a monthly basis, April is actually higher, but October does come in second.
What’s it all mean? For whatever reason, October is when things can get extremely volatile. This year the volatility started off to the upside, with the best start to an October in 77 years. The second half of the month is when we have seen some of the largest drops, so be open to more market volatility here.
Thanks for reading.
Twitter: @RyanDetrick
Read more from Ryan on his tumblr.
Any opinions expressed herein are solely those of the author, and do not in any way represent the views or opinions of any other person or entity.

: Showing Some Signs of Emerging Strength")
