We’re almost to October and that could mean better things for the bulls. As I noted here on See It Market on September 18, the next few weeks were very bearish for the stock market based purely on seasonality. This played out well last week, but I don’t think we’re out of the woods yet. Most of my studies have shown bottoms occurring the second half of October.
The average year since 1950 peaks on September 19 and doesn’t form a major low again till October 26. Wouldn’t you know it, but this year we peaked on September 18. Could it take another month till we can form a tradable low? History says that could be the play.
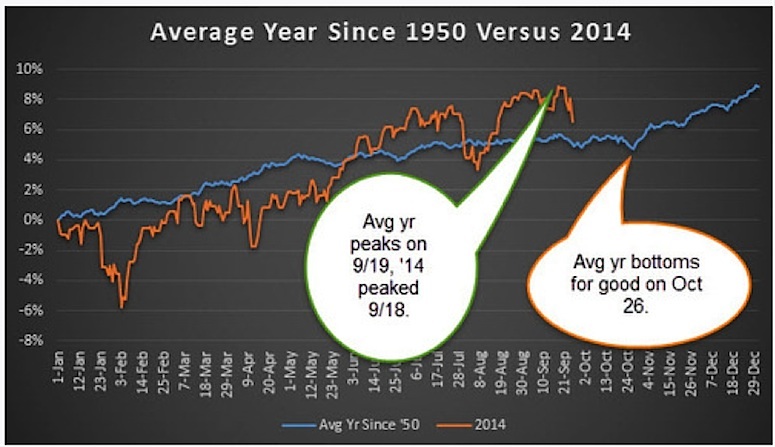
Note: Each data point on the blue line on the chart above presents the average for each day of the year since 1950.
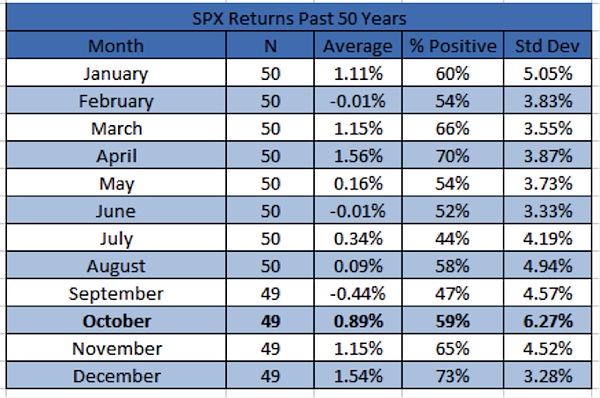
Let’s breakdown the average October stock market a bit further. The past 50 years October ranks as the sixth best month, but it also has the highest standard deviation. In other words, big October stock market moves are perfectly normal.
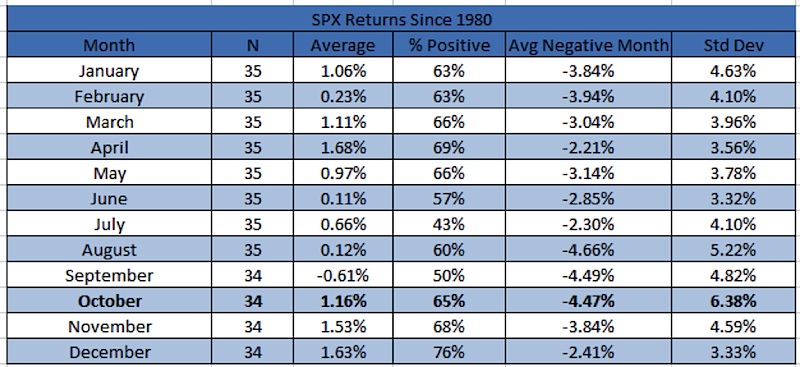
More near-term, we see similar results. Since 1980, October is fourth strongest month, but again it has the highest standard deviation.
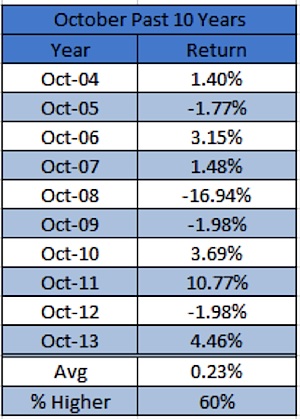
The past 10 years October is just slightly positive, but I’m impressed with that because it includes a -16.94% drop back in 2008.
Here’s where things get interesting. So October is a middle of the pack month most years, but remember this is the second year of the four year Presidential cycle. Turns out, October is the strongest month during this year. Going back to 1950, October is up a solid +3.35% on average and up three out of four times. Not too bad.
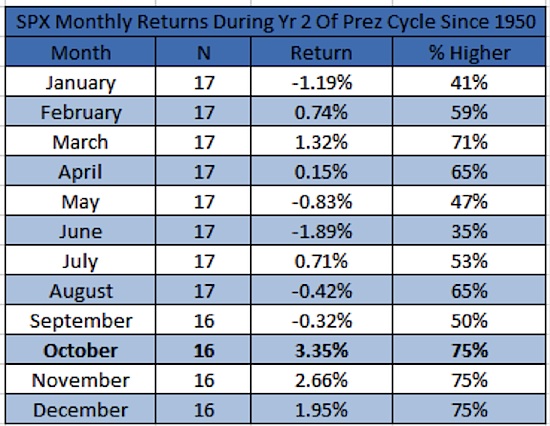
My pal and fellow SIM contributor Andrew Thrasher shared the above chart in his must read Weekly Technical Outlook this week. If you aren’t reading Andrew’s update every week, then you need to start soon.
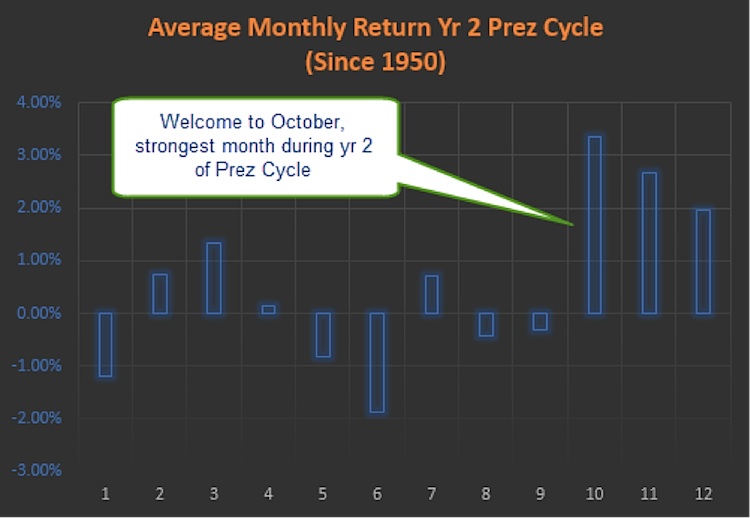
Now here’s a chart with another way to view this data for those that like pictures.
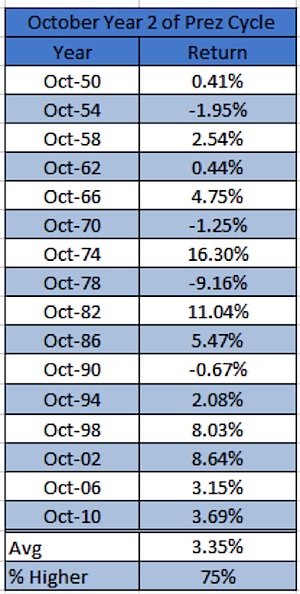
Lastly, here are all the October stock market returns during the second year of the Presidential cycle. It has been up the past five times and the smallest gain was a solid +2.08% in ’94.
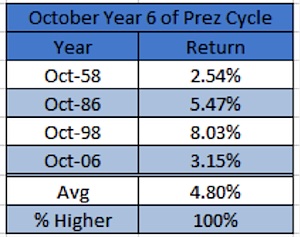
Remember though, this is President Obama’s second term, so you could also say this is his sixth year in office. Doing this once again yields very strong results for October.
September had all the bearish seasonality and that played out, now with October I see many reasons to be on the lookout for a potential move higher before the month is over. Good luck out there.
Follow Ryan on Twitter: @RyanDetrick
No position in any of the mentioned securities at the time of publication. Any opinions expressed herein are solely those of the author, and do not in any way represent the views or opinions of any other person or entity.


