Closing quotes demurely scrolling across your monitor at the end of a market session rarely ever tell that day’s tale.
The long-term or Passive investor will argue (rightfully, for their strategy) all that occurs in the space between opening and closing bell – the beneficent and the bedlam – is noise:
- The messy field lab where what eventually becomes market efficiency is bred.
- The endorphin-laden detritus broken off where human impetuosity hamfistedly grafts itself into swirling capital flows.
- The reserve of killer-machine algorithms where their Most Dangerous Game is played on a field of quantum particles;
- The useless – almost iniquitous – productivity sink where vain projects of hubristic human ingenuity bent on “timing the market” play out in sad futility and eventual ruin.
Most active traders and investors I know will concede just about all of that – they’re too pragmatic and comfortably uncertain to bother with pitched ideological battles – and then get on with working their processes (with their defiantly positive mathematical expectancies) in the place where skill meets price discovery during market hours.
But for the sake of argument, take last Tuesday.
By the end, your line graphs told you the S&P 500 (SPY) +0.69%, the Dow (DIA) finished +0.56%, the Russell 2000 (IWM) +0.39%; and the NASDAQ 100 (QQQ) ended up +0.33%. Not a bad day: the S&P 500 even returned to positive territory YTD (the 7th time it has lost, then regained it so far in 2014). But what happened in between?
Here’s the 1-minute chart of IWM on Tuesday:
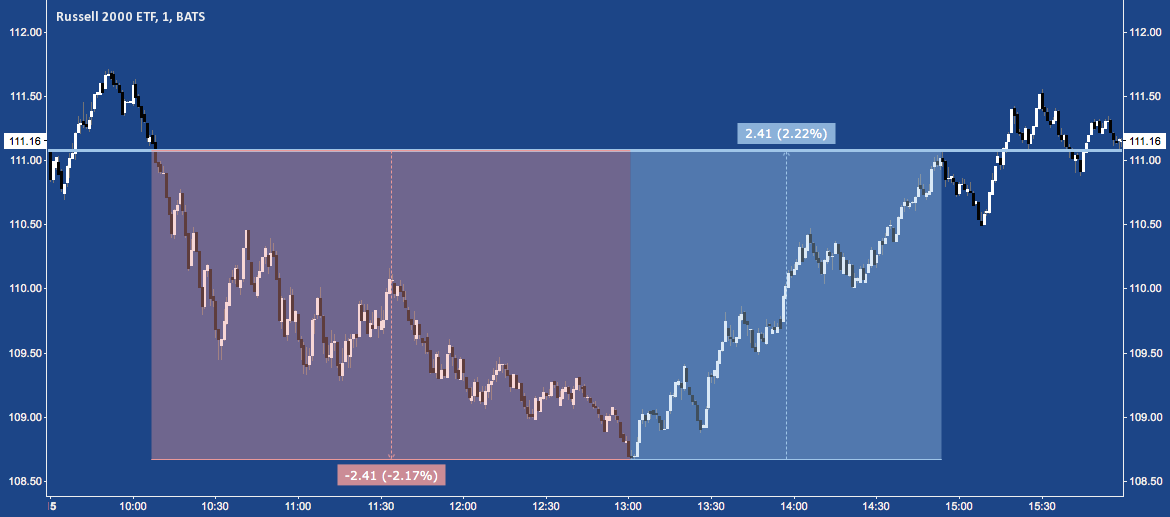
In 5 hours and through a massive intraday reversal, IWM created noise equal to 36 times the S&P’s YTD performance.
But so what? Meaningfully trading it entails transactions, size and perhaps leverage: the elevated cost and risk inherent to exploiting whatever setups are hinted at in this chart – to say nothing of timely entries and exits. Moreover, would any profitable trades actually have a positive alpha?
This can make intraday ranges – and trades taken inside them – easy to dismiss as the ulcer-inducing purview of the white-knuckled, keyboard-demolishing, gunslinging day trader (as seen on Youtube).
But that creates a misguided caricature of mid-session moves, which – even those entirely negated by the close, like this one – often have valuable import beyond that day.
A key precept of Candlestick analysis teaches what goes inside a period (a day, minute, week, or month) is arguably as important as where that period ends. Almost every key reversal pattern in the broad Candlestick repertoire treats shadows or wicks – i.e., the noise – as vital.
Now let’s look at last Tuesday in another way.
This week, Monday and Tuesday each opened and closed above IWM‘s 200-Day SMA (green) but saw intraday trading below the line. Taken by itself, the resilience at this key long-term measure of trend is bullish because dip-buyers demonstrated their cognizance of where the 200-Day is, along with their willingness to buy there. For those who won’t be bothered with contemplating these short-term squiggles, IWM has yet to close beneath this level.
Here’s how the noise proves it isn’t in this case.
Before these two occurrences, since IWM‘s inception in 2000 (the 200-Day begins plotting in Spring 2001) price has traversed the 200-Day SMA 241 times. “Traverse”, by the way, simply means “to cross”: whether that’s on a closing basis, an intraday basis only, or via an overnight gap-down or gap-up.
Of those 241 occurrences, 241 (100%) have seen a close or (with a gap down) open beneath the 200-Day within 10 adjacent sessions. In other words, every time IWM has ever interacted with it’s 200-Day, sometime in the 10 days before or after it has closed (or opened) beneath it.
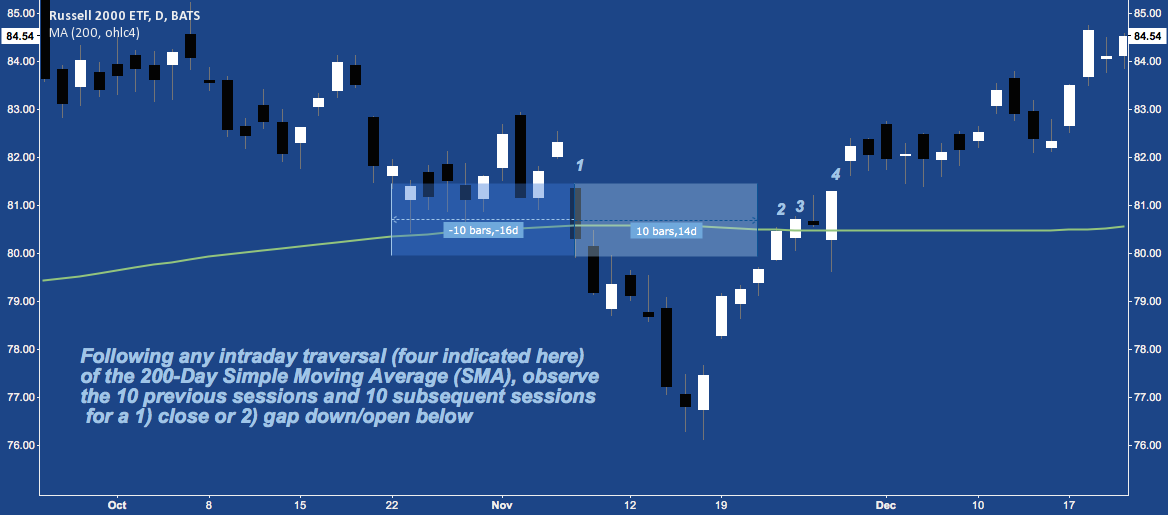
To see how this works, here are the latest occurrences (from November 2012):
From the traversal of the 200-Day – labeled “1” – we look 10 sessions forward and back. In this case, the interaction with the 200-Day saw no closes in the 10 previous days; but did close beneath on that day (at 1) and all 10 days afterward. In a different example, Traversal days “3” and “4” did not close beneath the 200-Day, but looking forward and back, we note that traversal day “2” did. You can see the rule spelled out in the lower-left:
Last week, Monday and Tuesday’s (labeled “1” and “2”, below) traversals – numbers 242 and 243 – of the 200-Day did not have a close (or open) beneath the line in the previous 10 sessions.
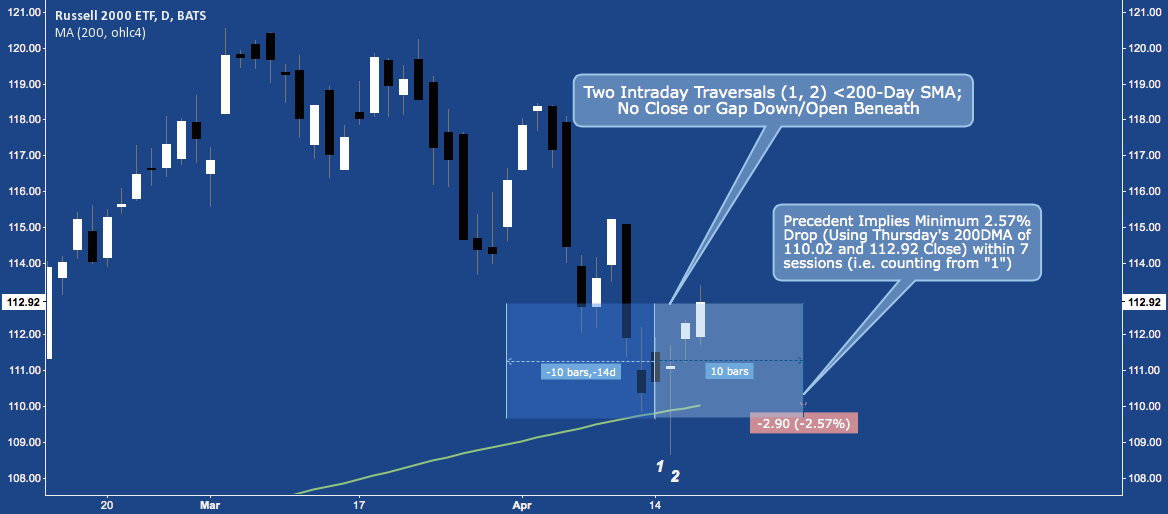
So, the noise is telling us there’s a probability of 1 (i.e. certainty) derived from all 241 prior occurrences that IWM will close beneath it’s 200-Day SMA within 10 sessions of Tuesday, or within 7 sessions. Based on Thursday’s 112.92 close, this suggests a minimum -2.57% drop to close (or gap down and open) below the 200-Day at 110.02 by the end of trading on Tuesday, 04/29. Not to put too fine a point on it; but the entire history of the Russell 2000 is giving a continued pullback signal.
A world of fat tails and skewed probability distribution, today’s historical certainty is tomorrow’s LTCM – “sure things” do not exist in the present. But where the past is objectively compelling and an asymmetrical bet is clear – like this – a great risk-managed trade is there for the taking.
Even if it’s short-term, steeped in the chaos of the average trading day and deemed “impossible” to replicate over the long-term.
Twitter: @andrewunknown and @seeitmarket
Author holds net short exposure to the Russell 2000 at the time of publication. Commentary provided is for educational purposes only and in no way constitutes trading or investment advice.
Tower image https://science.jrank.org/kids/pages/20/Radio-or-Telephone.html
Any opinions expressed herein are solely those of the author, and do not in any way represent the views or opinions of any other person or entity.


