 I’m honored that Andy asked me to come back a second year for the Market Masters series. Last year I focused on how I used sentiment in my trading; this year instead I’ll focus on common trading myths. For years now the masses continue to follow the crowd and just assume old trading axioms are gospel. “Sell in May,” anyone? Well, May is actually up on average since 1980 and there was a time in the ‘30s and ‘40s when traders said, “Buy in May, make some hay.” Times change, and as traders it is our job to adapt. You want to adapt first to stay ahead of the game. “Adapt or die” is one of my favorite trading rules. With that, here are six popular trading myths exposed.
Trading Myths – #1 Light Volume Is Bearish
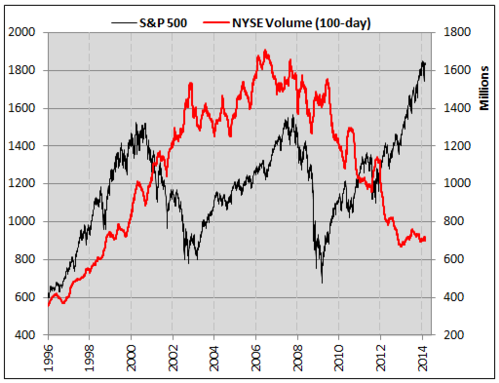
How long and how many times have we heard this one? Since at least September ’09 the bears have been saying volume is light, and this is a warning. Here are the facts. Overall, NYSE volume is indeed lower.
The catch is this volume didn’t just disappear — traders have moved to options and futures. Check out equity option volume for one thing. Quite the different picture.

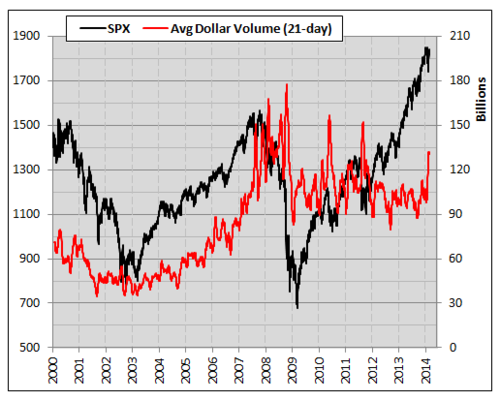
Now what about the fact that stocks are more expensive than five years ago? Of course volume is lighter now when Apple is $500 versus when Bank of America was around a buck. To gauge this, we like to look at all stocks in the S&P 500 Index (SPX) and find their daily average dollar volume (stock price times stock volume). Then, to smooth things out, take a 21-day moving average of the results. Below is a chart of what was found. First things first, total-dollar volume is indeed less than during the peak of the financial crisis. However, it’s also still well above the bull market from 2003 to early 2007. So again, a very simple question comes to mind: If total-dollar volume is higher now than the last bull market, how in the world can bears say lower volume is bearish? Not to mention spikes in volume tend to occur during pullbacks! So volume is higher now than the last bull market and higher volume is actually bearish, not the other way around like so many claim… making this one of the higher profile trading myths.
Trading Myths – #2 Copper is crashing, which suggests a slowing global economy and warning for stocks
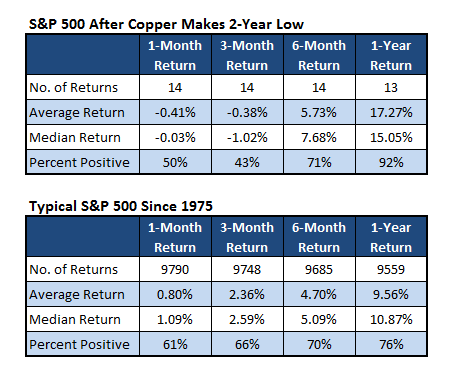
You’ve heard about Dr. Copper, right? He has his Ph.D. in Economics and tends to predict some major trends in the global economy. With copper breaking down to multi-year lows, I checked to see just how accurate Dr. Copper is. Turns out when Copper makes a new 2-year low, the S&P 500 doesn’t do too bad. Three months later it is about flat, but a year out it jumps 17%.
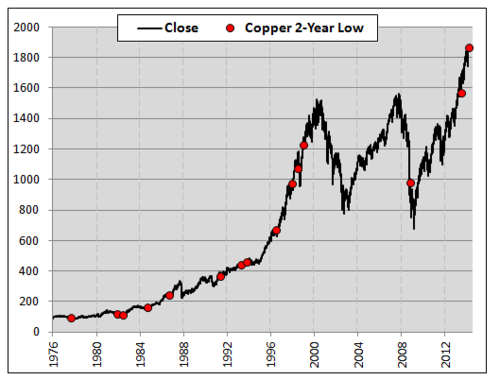
Here’s a chart. Tough to say this is bearish for the S&P 500.
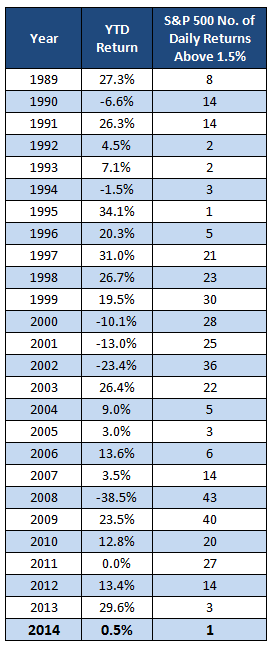
Trading Myths – #3 Big Up Days Are Always Bullish
Funny thing about seeing huge up days — they usually happen in bear markets. Last year, when the S&P 500 had a great year, it saw just three days gain more than 1.5%. Compare this with 2008 when the index dropped 38%, but saw 43 days gain more than 1.5%. Slow and steady usually wins the race in investing.
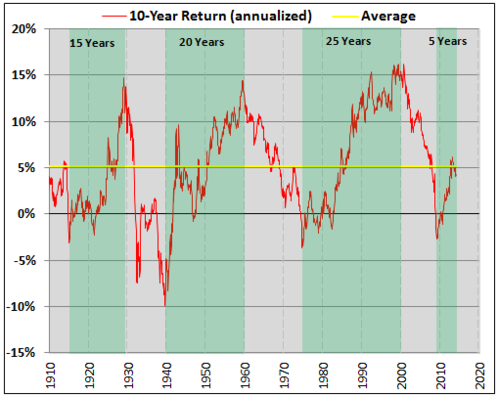
Trading Myths – #4 The Dow is up five years in a row, and this has to be bearish as we’ve gone ‘too far, too fast’
Here’s one of my favorite longer-term bullish charts. The 10-year annualized return on the Dow is about 5%. As you can see below, this is just average going back to 1910! In fact, bull markets don’t end until closer to 15 to 20 year runs and an annualized return of closer to 15%.
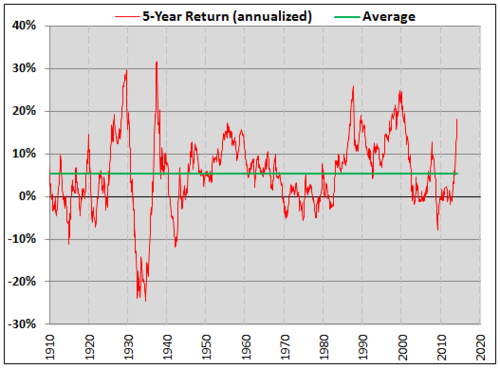
Now, everything isn’t perfect (it rarely is), as the 5-year annualized return is getting up near previous peaks. In fact, we are now above the peak in 2007, but well below some other peaks. So this is a potential near-term warning, but not a signal this bull market is dead either.
Trading Myths – #5 This Year Looks A Lot Like 1929, So We’re Going to Crash
You’ve probably heard a lot about this one. Turns out the chart today looks just like the chart in 1929 before the crash. Well, it isn’t quite that simple. Yes, on a daily chart, things look a lot alike, but when you look at the percentage returns – not so much.
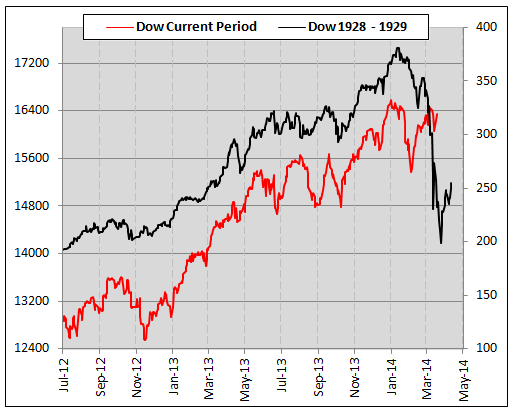
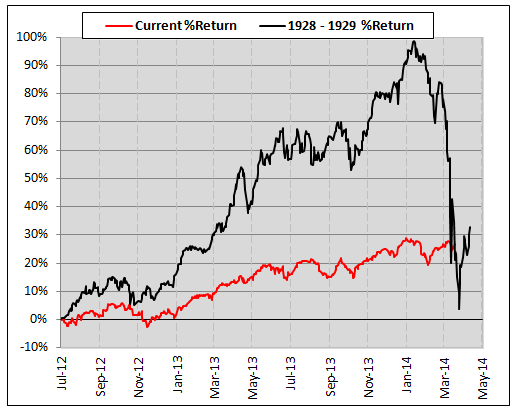
That same chart that is causing so much fear doesn’t look so similar now, does it? The rally into the ‘29 peak was a historic blow-off top. I’m not saying this current one isn’t getting ahead of itself, but this is a more ‘apples to apples’ comparison if you ask me.
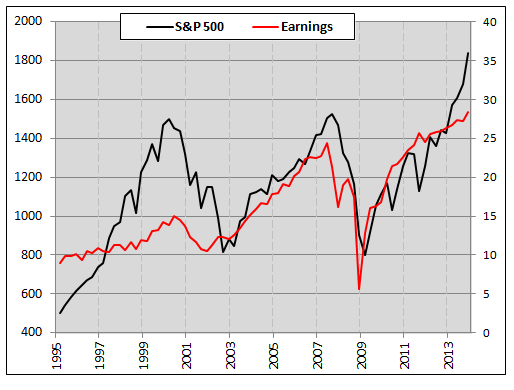
Trading Myths – #6 Earnings Predict The Stock Market
So, how about this trading myth. Last year the S&P 500 gained nearly 30%, while earnings jumped less than 6%. Then again, earnings gained 6% in 2002 and the index lost 23%. Or the huge 37% jump in earnings in 2010, while the S&P 500 gained just 12%. Versus the flat earnings growth in 2009 and a nice jump of 23% on the S&P 500. Maybe earnings growth doesn’t matter?
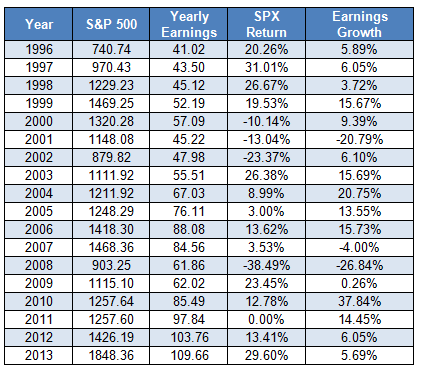
Or perhaps this is one of the trading myths that requires another layer of research. So what should you be watching? To me it is the trend of the earnings. This seems to matter much more than the magnitude of the growth.
There you go, hope you enjoyed this post on trading myths. Good luck in your trading! Be sure to follow me on Twitter or StockTwits @RyanDetrick or read my market thoughts at www.schaefferstradingfloor.com.
About Ryan Detrick: Ryan is a Senior Technical Strategist at Schaeffers Investment Research. He is a frequent guest on CNBC, Fox Business, and Bloomberg Television.
No position in any of the mentioned securities at the time of publication.
Any opinions expressed herein are solely those of the author, and do not in any way represent the views or opinions of any other person or entity.


