I’m honored that Andy asked me to be part of the “Market Masters” series. Given I go first, I like the fact there is no true format or anyone to follow, so I’ll just jump right into it…
Today I want to talk about investor sentiment and how it can help your trading. Everyone uses fundamentals and technicals in their trading, but at Schaeffer’s we focus a good deal on investor sentiment.
In the purest sense, we ‘buy expectations, not prices.’ If no one wants something, that could be an asset that with the right news, could have an explosive move.
I’ll talk more about this in a moment, but the flipside is once something is loved by everyone, you might want to avoid it. When South Park did a “Cash For Gold” spoof in March ’12 that was a big warning that everyone knew gold was up a lot and had a big run. Gold was $1,650/oz back then and is $1,450/oz today. The poster child for being over-loved is Apple (AAPL). No one would say a bad word about it last year, as all it did was go up. Yet, in September you had Kim Kardashian tweeting and congratulating AAPL on being the world’s largest company. Sure enough, it peaked soon after and has dropped 35% since. In fact, it is one of the 10 worst performing stocks in the S&P 500 (SPX) this year. J.C. Parets wrote bearishly on AAPL near its peak. He’ll tell you he never received so much hate for any call he’s ever made. That right there was a sign he was probably right.
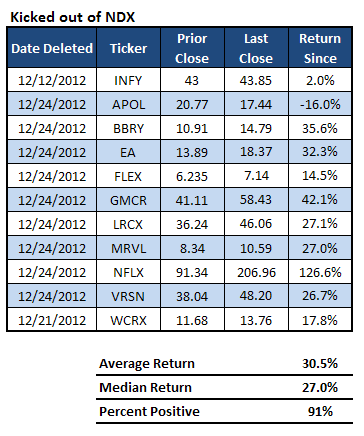
Speaking of AAPL, Barron’s just named them the #1 stock in the Barron’s 500 last weekend. This survey honors stellar operating performance. They were #2 in 2012 and #4 in 2011. This is a great point: operating performance doesn’t equal share performance. It all boils down to investor sentiment and expectations. We did a study last December that looked at how names that were kicked out of the Nasdaq-100 Index (NDX) did the following year. Not too surprisingly, they did very well. In fact, they did much better than the names that were added! Think about it, the overall investor sentiment on names kicked out of the Nasdaq 100 is about as low as it can get. Now, sure they could go bankrupt, but what if they don’t? Any good news at all and the gains could be explosive. Netflix (NFLX), BlackBerry (BBRY), and Green Mountain Coffee Roasters (GMCR) were three of the most hated names you could find late last year. Yet, they all had some nice outperformance in December. Sure enough, all three are up significantly with NFLX the biggest winner in the SPX.
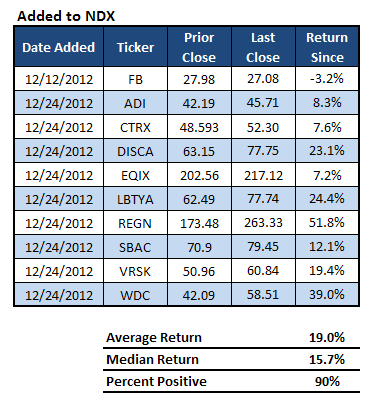
Now check out Facebook (FB) in the chart to the right. They are the only company that is actually lower since being added. Again, there is nothing wrong with FB as a company, it is the overall sentiment and expectations that got too high for them to fulfill the demands.
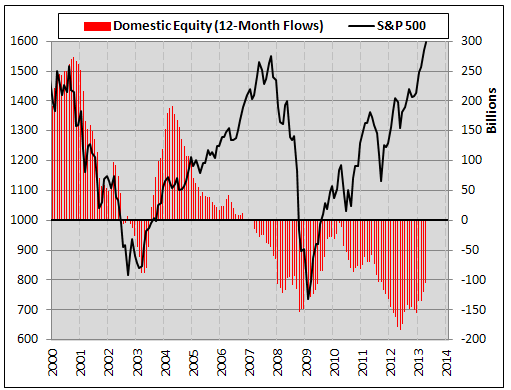
I’ll talk now about some market indicators that I use that would suggest this bull market is alive and well. Remember, markets peak at euphoria (max investor sentiment) and I just don’t think we are anywhere close to that. Just this morning I read that CNBC ratings have imploded. Squawk Box and Closing Bell are both down 16% from April ’11 to April ’12. Given we are in a big bull market, I find that amazing. Another recent survey of “high income/tech savvy” people found that 43% in the 21-30 age bracket consider themselves ‘conservative’ investors. Versus just 31% from baby boomers. From 2009-2012 there were $611 billion outflows from domestic mutual fund and $19.84 billion inflows in ’13, according to the ICI. So just 3.25% have come back. Now they might not ever come back, as they have moved to ETFs instead. Still, this type of investor sentiment is not what you’d expect to see at a major market peak.
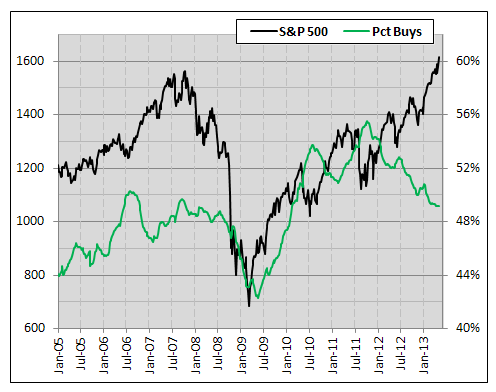
Total short interest on SPX components is up 15% so far YTD. At the same time, the SPX is up 13%. Say what you want about what will drive the next move, my take is there are still way too many people betting against this rally and they could fuel it higher. Incredibly, analysts have grown more bearish as the SPX goes higher. Take a look at the percentage of “buy” ratings out of all analyst ratings on SPX components. This peaked over 70% back in 2000; that is pretty one-sided. Back in late 2011 it was at 55%. After an SPX gain of more than 30% since then, the analysts have actually grown more bearish. Currently, just 49% of all the ratings are a ‘buy.’ Again, from a bigger-picture backdrop look at overall market / investor sentiment, this isn’t consistent with how markets peak.
As a technician, I like to look at various chart patterns and one thing that has stood out the past few years is how quickly the masses are to jump on the bearish patterns, while nearly outright ignoring the bullish patterns. Again, from an anecdotal point of view, I love seeing that.
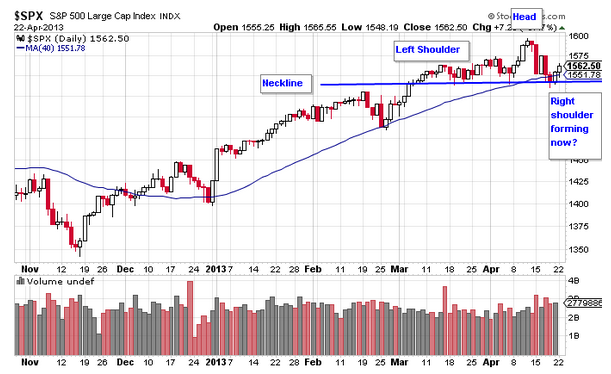
A few weeks ago, there was talk of a head-and-shoulders peak on the SPX BEFORE the right shoulder had ever started to form. Wow.
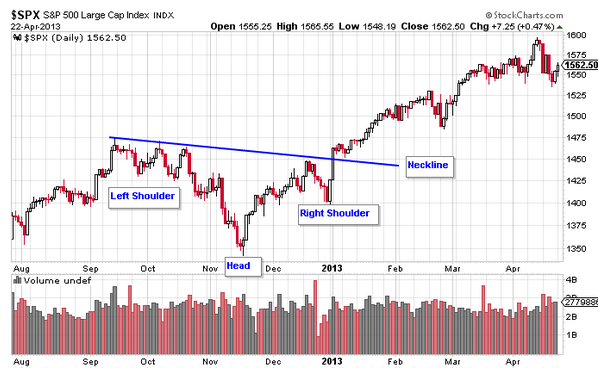
Of course, that pattern didn’t pan out, as the SPX moved right on to new highs pretty quickly. Yet, there was a picture perfect inverse head-and-shoulders pattern that formed the last few months of 2012 that was totally ignored. Remember back then, when all we heard was how bad the Fiscal Cliff was going to be? Investor sentiment was pretty bad. Guess following price action would have been more beneficial than following the news.
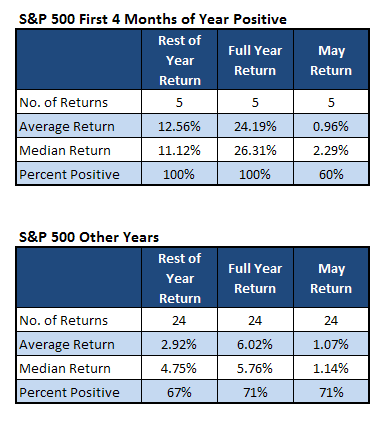 Lastly, I like to use quantified data to get a gauge of history and where we might be going. Here are some recent studies we’ve done that show this rally could have legs. We’ve heard a lot about how weak May has been and how selling the past three years was the way to go. That is all true, but it is important to never take this stuff as gospel. For instance, the SPX was up each of the first four months this year. Going back 30 years that has only happened five times, yet the results in May are actually bullish – up about 1% on average. More importantly, the remaining eight months of the year the SPX was up every single time for a solid 12.56% return on average. Strength begets strength sometimes. See table to the left.
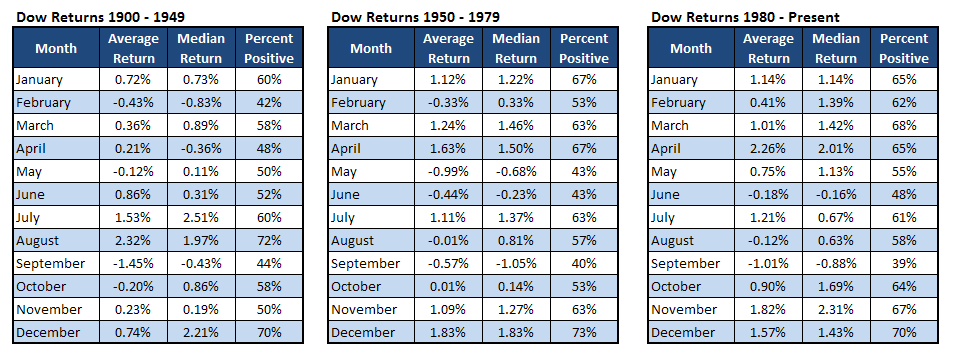
As some old timers might remember, there was once a saying “Buy in May, Make Some Hay.” If you look back from 1900-1948 buying in May was a very profitable plan as June, July, and August were the three strongest months. This doesn’t mean selling in May won’t work — just be aware that once everyone catches onto something, I’d be leery to put a lot of faith in it.
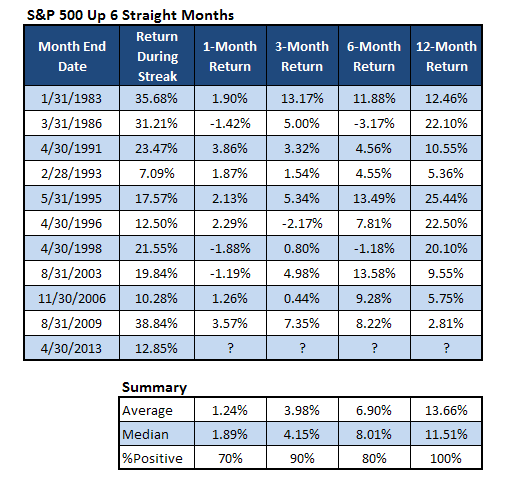
The SPX is up six straight months, that has to be bearish right? Looking at the last 10 times this has happened, the SPX was up 12 months later every single time, up +13.66% on average. Even the 1-, 3-, and 6-month returns are incredibly bullish looking.
 So there you go. It is tough to explain how I look at the world in one post, but hopefully this post opened your eyes to incorporating investor sentiment in your trading to help your overall results. Be sure to follow me on Twitter at @RyanDetrick or read my market thoughts at www.schaefferstradingfloor.com. Good luck in your trading.
About Ryan Detrick: Ryan is a Senior Technical Strategist at Schaeffers Investment Research. He is a frequent guest on CNBC, Fox Business, and Bloomberg Television. Read more about Ryan here.
No position in any of the mentioned securities at the time of publication.
Any opinions expressed herein are solely those of the author, and do not in any way represent the views or opinions of any other person or entity.


: Showing Some Signs of Emerging Strength")
