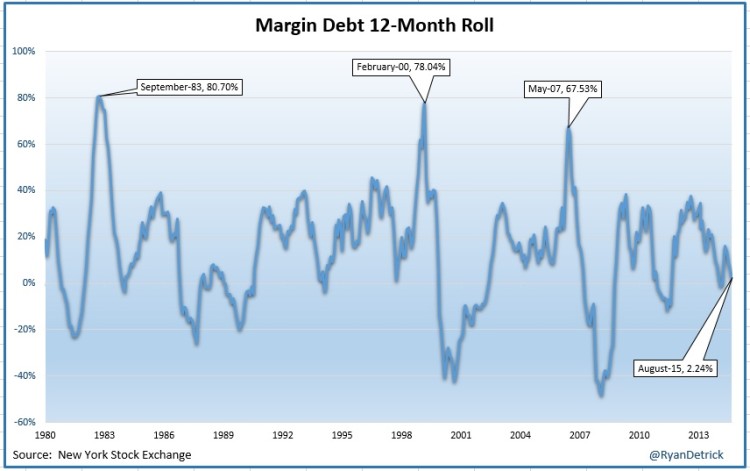
In other words, everyone gets all excited and goes on margin all at once. We didn’t see that this time.
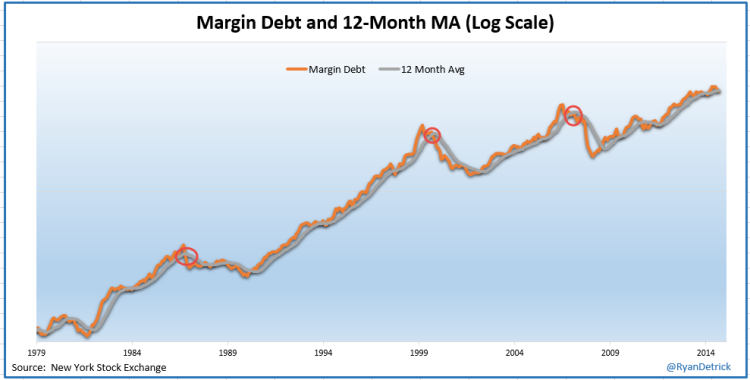
What’s it all mean? Well, this rollover is extremely concerning to me. Should it continue, I don’t see how it can be a positive for equity prices. The one chart I’m watching for clues is the 12-month moving average of margin debt. As you can see, violations of this longer-term trendline have marked some major peaks for equities. This hasn’t given way yet.
Thanks for reading and have a great weekend.
Twitter: @RyanDetrick
Any opinions expressed herein are solely those of the author, and do not in any way represent the views or opinions of any other person or entity.


