The S&P 500 (SPX) is now up 1.2% over the last 9 sessions (effectively unchanged for the last 3), compared to a gain of +10.26% in the previous 12. This short-term trend regime switch from the “indisputably up” of late October to the “gap-ridden sideways muddle of sessions that add up to a rounding error” that has characterized November begs the question: are stocks merely “correcting by time” (a euphemism for “price discovery by amnesia”) before ramping into the end of the year; or is a pullback in the offing?
One short-term sentiment indicator that has proven almost prescient at laying out where price will flips from up to neutral (and usually, down) is the ISE Sentiment Index (ISEE), a unique put-to-call ratio that measures only customer (as defined by CBOE et al.) long option transactions. Below, we’ve charted SPX with every daily ISEE reading over the last 12 months where long calls have exceeded long puts by at least 2:1 (or 200) to gauge the three recent sessions satisfying this criterion against their peers:
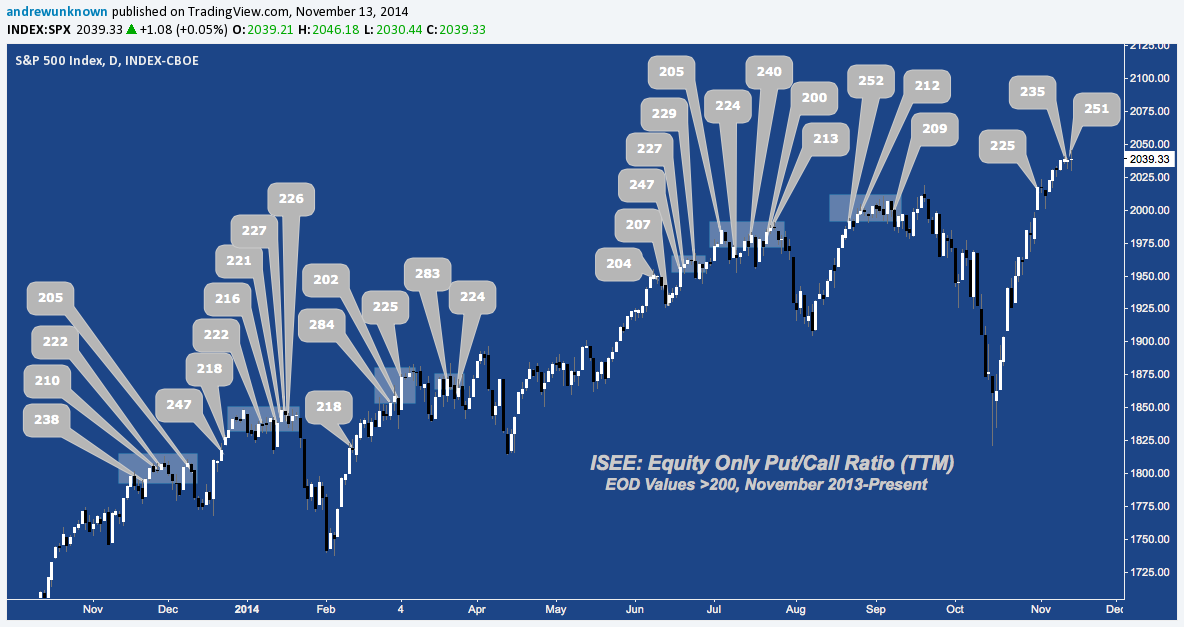
Interestingly, there isn’t a single ISEE above 200 over this period that hasn’t been 100% retraced within the next several weeks. Excluding early February’s single reading, ISEE >200 clusters of 2 or more readings in close proximity have followed a very similar pattern: 1) neutral, churning action over the next several weeks – averaging 22 sessions from the first >200 read to the local price high – before 2) giving way to significant underperformance (-5.39% over 11 sessions, average). The worst drawdown sustained by opening a short on market close from the initial >200 reading in a cluster (excluding early February) before 100% retracement is -2.3% (from 02/27’s ISEE 284 print to 04/07’s high).
Including 10/31/14, the ISEE put/call ratio has now registered 3 >200 readings in the last 10 sessions, advancing 1.39% over the same period. Comparing this stat against the drawdown and pullback statistics above, both a general backdrop and concrete framework against which to assess near-term directional risk emerges. Recent history suggests the grinding consolidation SPX has succumbed to over the last few days is typical, with the disproportionate call buying now underway likely to be the victim of theta burn before a new pullback unfolds over the next month or so.
Post-script: Does this contradict the universally-touted and quasi-cultic preoccupation with “positive seasonality” for this period? Not necessarily – look no further than late 2013 for evidence: the first >200 print last November saw a -1.6% dip over few weeks; but was +3% net a month after that (thanks, Santa). That sounds about right; until January’s tight cluster of 5 >200 readings prompted a -6% drop for a net -3.2% performance over this 2.5 month period.
Trade ‘Em Well.
Twitter: @andrewunknown
Kassen holds no exposure to securities/instruments mentioned at the time of publication. Commentary provided above is for educational purposes only and in no way constitutes trading or investment advice. “Call/Put” image courtesy of https://www.strategieopzionibinarie.eu

: Showing Some Signs of Emerging Strength")
