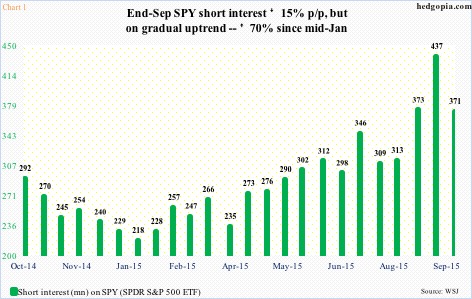
During the September 15-30 reporting period, SPY short interest on the SPDR S&P 500 ETF (SPY) dropped 15 percent period-over-period. This was interesting because the ETF shed 2.9 percent during the period, having just tested the August 25th closing low. Shorts probably covered thinking that low would hold, and they were right.
Since that low, the S&P 500 ETF has rallied eight percent. Just last week, it looked like a great time to be selling puts, and the hypothetical SPY trade initiated last Monday paid off.
With regards to SPY short interest, we are still in the October 15 reporting period, which will not be reported until October 26th.
But just looking at the persistent increase in SPY short interest over the past several months, it is possible the recent spike in the S&P 500 ETF probably caused some level of squeeze (see Chart 1 below). But maybe not a whole lot.
Yes, SPY did rally past $198-$199, but there is a major hurdle looming on the horizon (see chart 2 below). Last Friday, it tried to take out the September 17th intra-day high, when stocks reversed after the FOMC decision, but was unsuccessful, producing a daily doji.
Daily momentum indicators are now in overbought territory. This is as good a place as any for the ETF (and stocks) to rest near-term. If lower, the S&P 500 ETF could go down to test the 50-day moving average ($198.75), which it recently crossed.
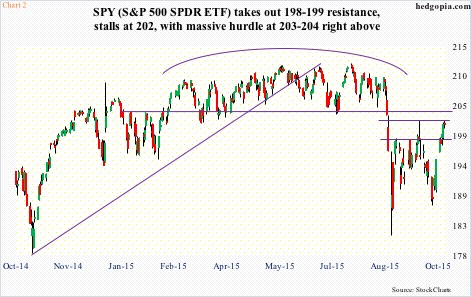
If SPY rallies past $202, the next level – and a major one – to watch of course is what happens at $203-$204. Considering the way this support was broken during the August sell-off, odds favor shorts will begin to get active around that level. The game changes, though, if bulls are able to force a breakout.
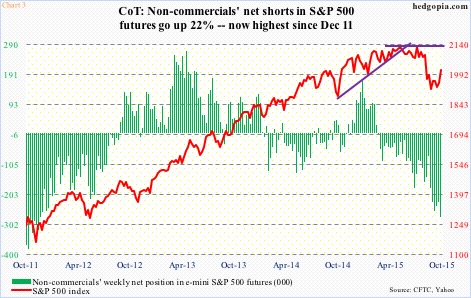
This, however, is not a scenario envisaged by non-commercials (from the COT Report). By last Tuesday, they increased net shorts in e-mini S&P 500 futures to 278,179 contracts, up 22 percent week-over-week, and at the highest since December 2011 (see Chart 3 below). This ties together with the increases we have seen in SPY short interest.
Simply put, they are treating the recent rally in the S&P 500 with suspicion.
Regardless how it all pans out in the medium- to long-term, non-commercials are probably on to something near-term. Odds have grown that the S&P 500, and of course SPY, would like to rest, if nothing else just to digest recent gains.
In this scenario, a naked call to either generate income or go short near resistance may be considered. Hypothetically, October 16th 202.50 calls fetch $0.84. If called away, it is an effective short at $203.34. The 200-day moving average lies at $204.34, by the way. Otherwise, it is a nice premium to keep.
Thanks for reading!
Twitter: @hedgopia
Author is short the S&P 500 (SPY) at the time of publication. Any opinions expressed herein are solely those of the author, and do not in any way represent the views or opinions of any other person or entity.

 Rolling Over At Key Fibonacci Level?")


