Perhaps one of the biggest surprises of the 2016 correction has been the overall depressing price action in bank stocks, financial services, and financial sector ETFs. A new era of Fed tightening had many believing that this would be the year that these stocks shined.
The financial sector after all was supposed to be the antidote to rising interest rates. Instead, the ETFs that track this group are facing a crisis of confidence in global credit and lending practices. And this has lead to more uncertainty with financial sector ETFs.
Know What You Own: Financial Sector ETFs
Breaking down this group can provide enhanced perspective on how some of the largest stocks are reacting to the current environment.
Reviewing The Playing Field – David Fabian
The fund getting the most attention during tumultuous period is the Financial Select Sector SPDR (XLF). This benchmark fund tracks 91 large-cap stocks in the banking, financial services, brokerage, and real estate industries. Top holdings include: Berkshire Hathaway Inc (BRK/B), Wells Fargo & Co (WFC), and JP Morgan Chase (JPM).
The financial stocks that make up XLF are arranged in a market-cap weighted structure, which allocates the largest percentage of capital to the biggest stocks in the index. This fund currently has $15.3 billion in assets, charges an expense ratio of 0.14%, and offers a 30-day SEC yield of 2.15%.
It’s worth noting that real estate investment trusts (REITs) currently make up 18% of the XLF index. Those that wish to eschew the real estate component may find the newly released Financial Services Select Sector SPDR Fund (XLFS) as a worthy tool. This ETF implements a similar portfolio of financial stocks with more of a pure play focus in banks and insurance companies.
Drilling down even further to the industry level reveals a well-known vehicle in the SPDR S&P Bank ETF (KBE). This fund owns 64 publicly traded banks on both the national and regional scene. Nevertheless, it differs from a fund like XLF because it arranges its holdings in an equal weighted manner. This means that each stock in the portfolio is given a similar distribution of capital in order to allow smaller companies to contribute meaningfully to overall performance.
KBE has nearly $2.1 billion in total assets and charges an expense ratio of 0.35%. The slightly higher expense ratio is common among more niche funds that focus on a smaller group of stocks within a particular sector.
Reviewing The Technical Picture – Aaron Jackson
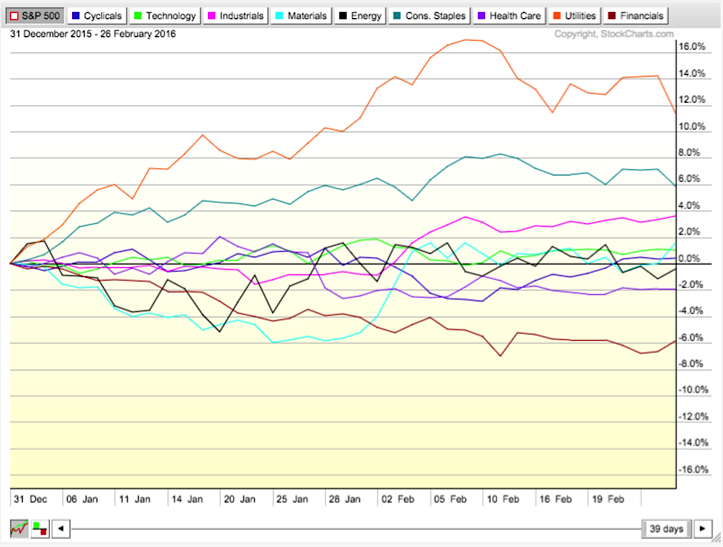
Many will quickly point out how financial stocks and financial sector ETFs have clearly lagged the market rally. And this is true, Financials are the worst performing sector year to date.
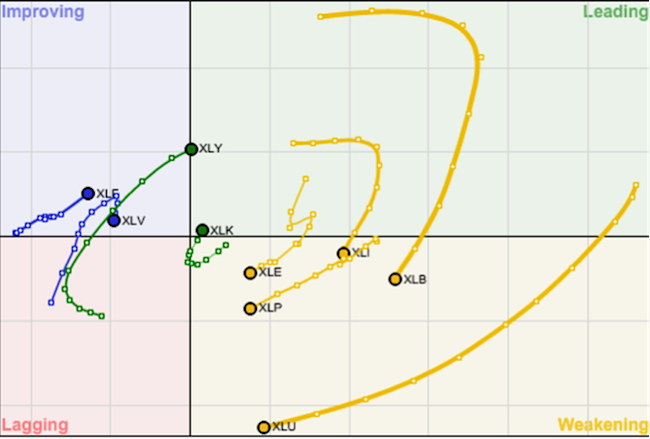
However, according to stockcharts.com’s relative rotation graph, the financial sector ETF (XLF) is starting to strengthen.
Now let’s compare the three funds.
Structurally XLFS has more beta and less yield than XLF. As expected, XLFS has underperformed it’s XLF counterpart during this market correction.
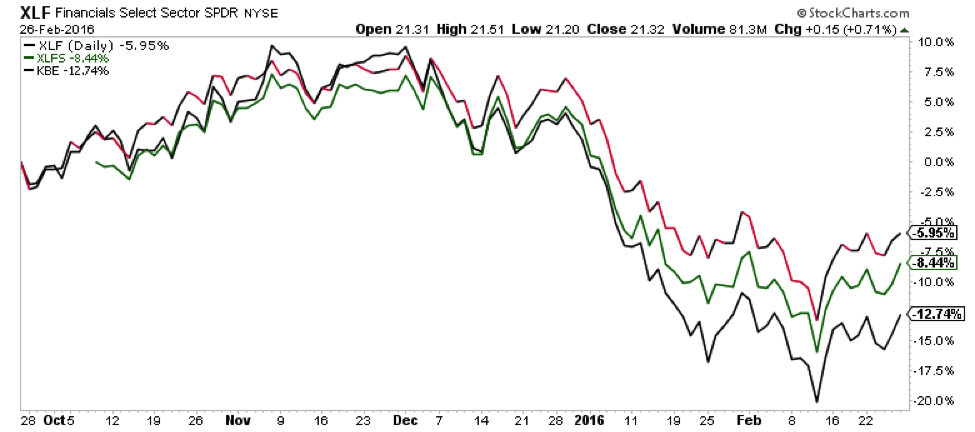
Also note Bank Index KBE is notably lagging XLFS. KBE contains many of XLF’s largest stocks / holdings. Why is this? The equal weighting of the index also leads to more beta and more volatile price swings.
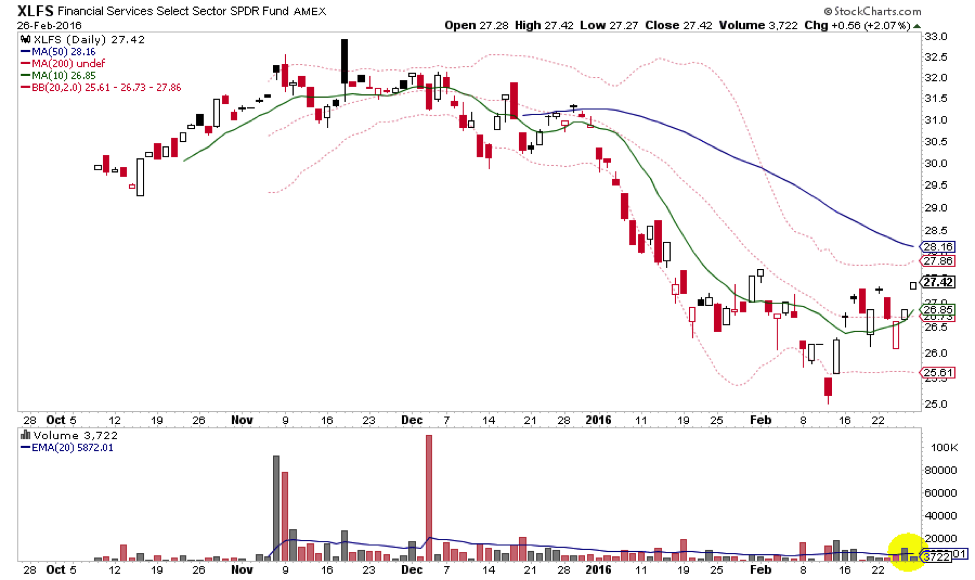
Also, since XLFS is a newer fund, we have to keep an eye on the volume trend. Currently, it’s just not liquid enough for investors.
Conclusions
- XLFS may be a better way to purely play financial stocks, but isn’t useful yet to investors as it lacks liquidity
- XLF is relatively defensive way to play financials.
- Funds with equal weighting are more susceptible to drawdowns in market corrections.
- While the financial sector has notably lagged the stock market, it is starting to improve technically.
Thanks for reading!
This article is part of a series co-authored by David Fabian (fmdcapital.com) and Aaron Jackson (northstarta.com). Each week we will be unlocking the secrets to some of the most talked-about exchange-traded funds in the market. The goal is to better understand what you own or elevate new ideas to the forefront of your watch list.
Twitter: @fabiancapital @ATMCharts
Neither author holds a position in the mentioned securities at the time of publication. Any opinions expressed herein are solely those of the authors, and do not in any way represent the views or opinions of each other or any other person or entity.

: Showing Some Signs of Emerging Strength")
