The energy sector is struggling and it’s pretty clear the whole industry needs more time to recover from and (more importantly?) adjust to last year’s massive price shock. And this shows up on the chart for the Energy Sector ETF (XLE)
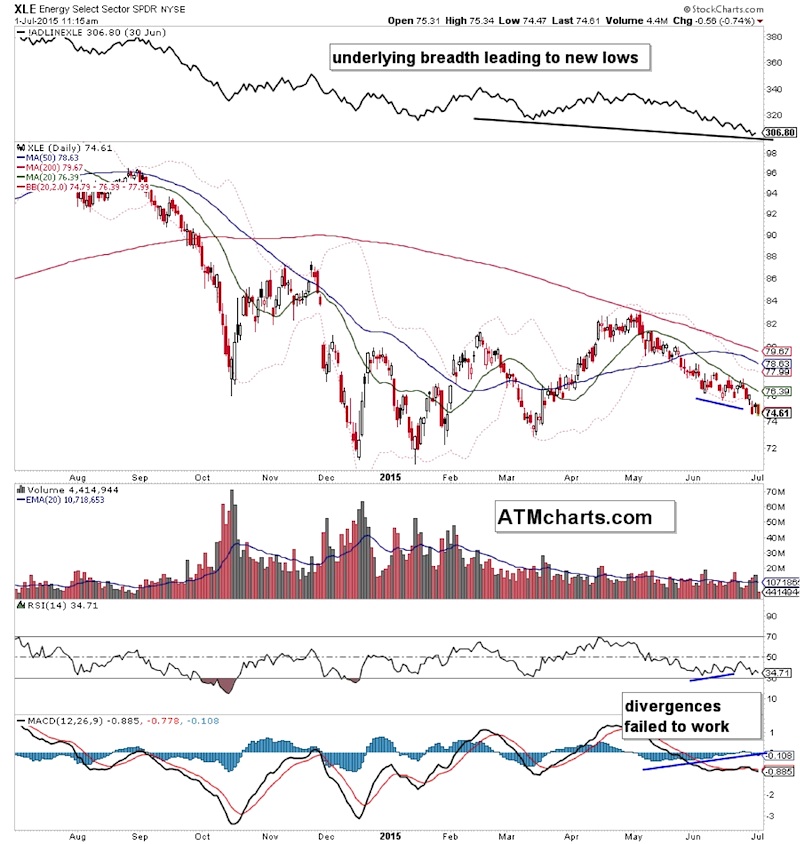
Looking at the chart below, there are a few takeaways that are important to note.
- Underlying breadth leads price to new lows.
- Momentum divergences failed to lead to a rally.
- The Energy Sector ETF (XLE) has consistently traded lower while the market remains range bound.
- 73 looks to be a major support area for XLE.
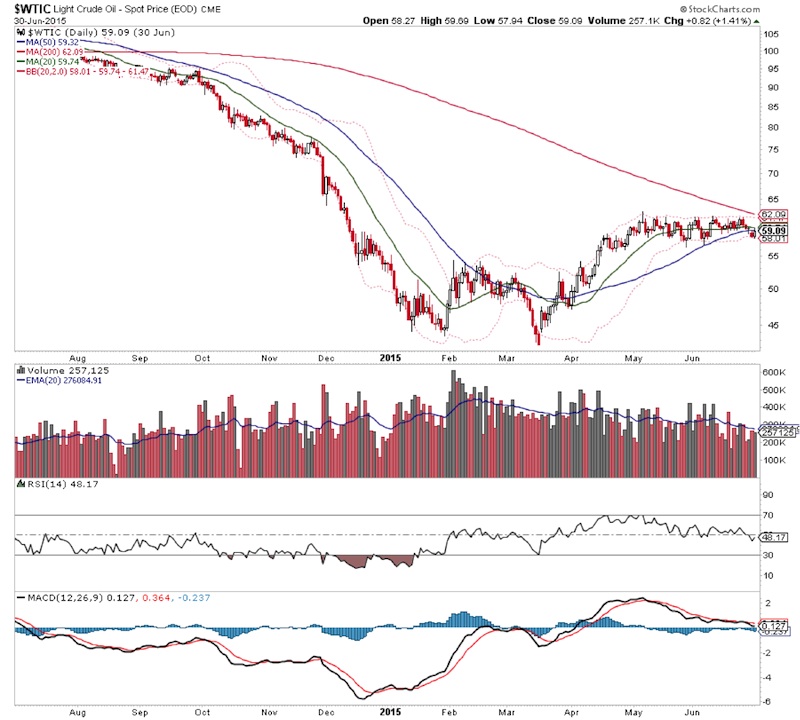
Now let’s look at a major component of the Energy Sector – Crude Oil itself. Since rallying into May, Crude has gone sideways.
Here are a few important things to note about Crude Oil right now:
- The falling 200 Day Moving Average has caught up to price.
- Price may be forming a two month rounding top between 56-62.
- Price has now fallen below the 50 day moving average.
- The 50 day moving average is flattening out.
In my view, there is not much to be positive about in the Oil and the Energy Sector right now. What would change the look? Some massive upside thrust. That said, it seems like the space still needs time to recover and digest last year’s massive price shock.
Thanks for reading.
Twitter: @ATMcharts
No position in any of the mentioned securities at the time of publication. Any opinions expressed herein are solely those of the author, and do not in any way represent the views or opinions of any other person or entity.

: Showing Some Signs of Emerging Strength")
