The Energy Sector has been one of the best performing sectors in 2014. The Energy Select Sector SPDR ETF (XLE) is up over 15%, and geopolitical turmoil in Iraq and the Ukraine have helped add fuel to the fire for the bullish case on this sector. However, with this large move in price, it appears the proverbial rubber band has become overextended.
Below is a chart of XLE going back to 1999, when the ETF began trading. In the top panel we have the daily Relative Strength Index (RSI), which is a momentum indicator. The Energy Sector ETF has never had RSI hit this high of a reading. While ‘overbought’ readings are themselves a sign of strong bullishness, when they get to these extreme levels I begin to grow a little concerned.
In the bottom panel of the chart we have MACD indicator, but I’ve set the parameters for us to be able to see how far price has gotten from its 200-day Moving Average. As of the time of this writing, XLE is 13% above its 200-MA, which has only occurred two previous times: 2008 and 2011 – right before we saw weakness enter this sector.
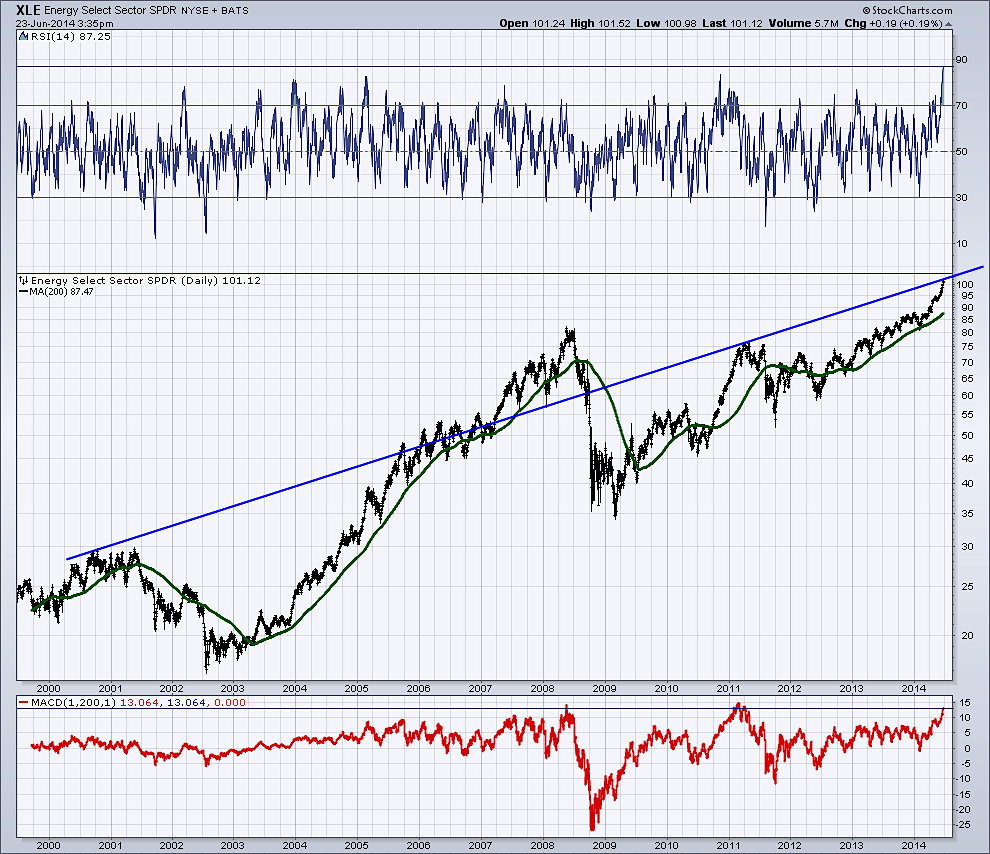
I’ve also drawn a trend line connecting the 2000 and 2011 peaks. Price is just a few hairs under this line, which may act as resistance if the bulls try to push price higher. Finally, based on data from the Stock Trader’s Almanac; the bullish period of seasonality for crude oil ends at the start of July. So as of next week, Crude Oil, which has helped drive the Energy Sector higher, will no longer be in a favorable period of seasonality.
With all of these factors, it seems we may see a period of mean-reversion for the Energy Sector as price consolidates or weakens. Looking at the two prior instances where XLE had gotten this far above its 200-day MA, price eventually corrected back to the long-term Moving Average and exceeded it before finding an eventual low point. We can’t know if that’s what will happen here, but I’ll be watching to see if we at least get a test of the 200-day in the coming weeks/months. We’ll see where price takes us.
The information contained in this article should not be construed as investment advice, research, or an offer to buy or sell securities. Everything written here is meant for educational and entertainment purposes only. I or my affiliates may hold positions in securities mentioned.
: Cup (and Maybe Handle) Watch")
 Reaches Important Price Support")
