Emerging Markets stocks, as measured by the iShares Emerging Market ETF (EEM), are near the measured move price objective from the multi-year range that was breached in 2015.
The chart of EEM below shows the defined range between about $36 and $45. The price objective of this $9 range is found by subtracting $9 off of the prior base of $36. This quick calculation yields $27.
I mentioned this potential scenario for $EEM in a post from August 2015.
Once the Emerging Market ETF (EEM) broke support at $36, it went on to tag $30. There was a throwback, or dead-cat bounce, which naturally found resistance at the prior support at $36. Notice in the chart below that the bearish price objective has confluence with the 2008-2009 bear market rebound highs at the $27 mark. That prior congestion zone should provide some support for the Emerging Market ETF.
Emerging Market ETF (EEM) – Measured Move to $27?
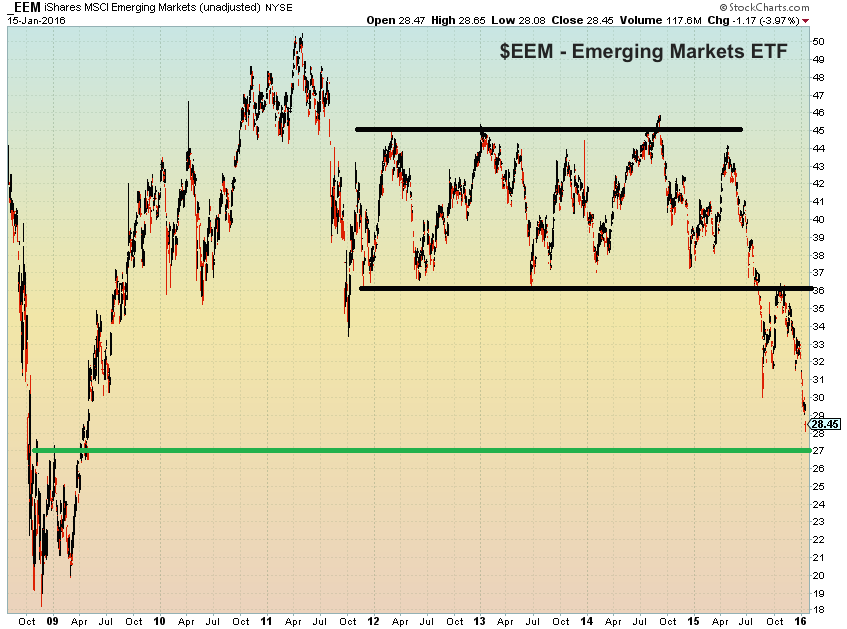
Both the $36 throwback level and the suggested $27 support from the 2008-2009 rebound highs illustrate the technical principal known as the “change in polarity principle”. Polarity simply says that once a support level is breached, it becomes a resistance level. The same holds true for resistance levels, once breached, they become support levels.
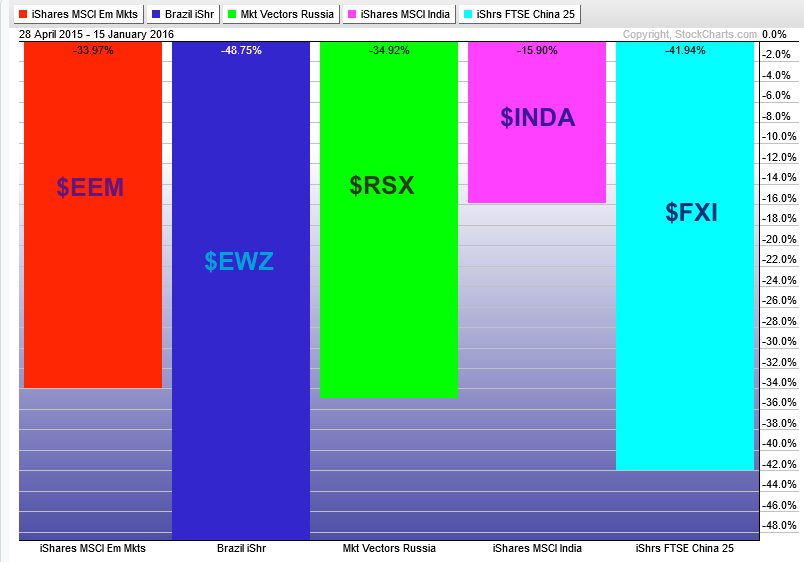
Now let’s take a quick look at the performance of Emerging Market ETF (EEM) and some of the more well-known (perhaps “infamous” is a better terminology) emerging markets ETFs. From the chart below, you can see that is has been a very rough ride for longs since April of last year.
A position in EEM has lost a third of its value in just the last 9 months. ETF’s for Russia (RSX), China (FXI), and Brazil (EWZ) have lost in excess of that amount over the same period. Meanwhile, the ishares India ETF (INDA) has been the outperformer, losing only 16%.
Thanks for reading.
Twitter: @MikeZaccardi
No position in any of the mentioned securities at the time of publication. Any opinions expressed herein are solely those of the author, and do not in any way represent the views or opinions of any other person or entity.

: Showing Some Signs of Emerging Strength")
